. 2008 Nov;38(11):3028-40.
doi: 10.1002/eji.200838417.

Defective B-cell response to T-dependent immunization in lupus-prone mice

Affiliations

Defective B-cell response to T-dependent immunization in lupus-prone mice

Haitao Niu et al. Eur J Immunol. 2008 Nov.

Abstract

Lupus anti-nuclear Ab show the characteristics of Ag-driven T-cell-dependent (TD) humoral responses. If autoAg elicit the same response as exogenous Ag, lupus should enhance humoral responses to immunization. Blunted responses to various immunizations have, however, been reported in a significant portion of lupus patients. In this study, we show that lupus-prone C57BL/6.Sle1.Sle2.Sle3 (B6.TC) mice produce significantly less Ab in response to TD immunization than congenic controls, while producing significantly more total Ig. This blunted Ab response to TD Ag could be reconstituted with B6.TC B and CD4+ T cells. Multiple defects were found in the B6.TC response to 4-hydroxy-3-nitrophenylacetyl-keyhole limpet hemocyanin (NP-KLH) compared with total Ig, including a smaller percentage of B cells participating in the NP-response, a reduced entry into germinal centers, and highly defective production of NP-specific long-lived plasma cells (PC) in the bone marrow. B6.TC PC expressed reduced levels of FcgammaRIIb, which suggests that reduced apoptosis in resident PC prevents the establishment of newly formed NP-specific PC in bone marrow niches. Overall, these results show that lupus-prone mice responded differently to auto- and exogenous Ag and suggest that low FcgammaRIIb, hypergammaglobulinemia, and high autoAb production would be predictive of a poor response to immunization in lupus patients.


Figures

Figure 1
Figure 1. Lupus mice produced fewer TD Abs after immunization
(A) Anti-NP IgG and IgG1 levels from NP-KLH immunized mice (left), anti-TNP IgG and IgG1 from TNP-CGG immunized mice (middle), and corresponding total Ig levels (right) in NP-KLH immunized mice. (B) Anti-NP IgM (left), and total IgM (right) from NP-KLH immunized mice. (A, B) Results are shown for 4 mice per strain at the indicated time-points in wks after primary immunization. Sera diluted 1:5,000 for anti-NP and anti-TNP Abs, and 1:50,000 for total Ig. The experiment was performed three times with similar results. (C) Anti-KLH IgG1 at 1, 2 and 4 wks after primary immunization (sera diluted 1:100). Means and SD of 16 mice per strain per time point. (D) Anti-dsDNA IgG levels following primary immunization (sera diluted 1:500). (E) Anti-NP Ab levels 10 days after secondary immunization (sera diluted 1:10,000). Means and SD of 8 mice per strain. Filled and open symbols represent B6 and B6.TC (indicated as TC) mice, respectively. Asterisks indicate levels of significance of t tests between the two strains at a given time point or isotype (*: p ≤ 0.05; **: p ≤ 0.01). Stars (⋆) indicate when statistical significance was reached for every time point in the graph. In (D), the difference between strains was significant either comparing each time point with t tests or comparing the slopes of the linear regression lines.
Figure 2
Figure 2. Either B6.TC B or T cells are sufficient for a lower Ab response to TD immunization
Anti-NP IgG, IgG1, IgM and total IgG, IgG1, IgM levels in B6.Rag mice transferred with splenocytes (SP) or a mixture of splenic B and CD4+ T cells, either strain-matched (B6 B + T or TC B + T) or mismatched (B6 B + TC T or B6 T + TC B) 4 wks post-immunization. All sera were diluted 1:5,000. Asterisks indicate levels of significance of Bonferroni's multiple comparison tests (anti-NP-IgG and IgG1), and t tests (anti-NP-IgM) (*: p ≤ 0.05; **: p ≤ 0.01; ***: p ≤ 0.001). Short horizontal lines indicate the mean. TC indicates B6.TC.
Figure 3
Figure 3. NP-KLH-immunized lupus mice produced fewer NP-specific B cells
(A) Frequency of λ1 + B220+ (left) and λ1 + B220+ IgM+ splenocytes (middle) at the indicated time points after immunization. The FACS plots show representative B220-FITC and NP-PE staining 4 wks after immunization. (B) BrdU incorporation in λ1 + (left) and NP+ or NP (middle) B220+ B cells 4 wks after immunization. The right FACS plot shows a representative overlay of NP-PE staining on B6 and B6.TC B220+ BrdU+ using the gating indicated in the left plot. (C) Frequency of λ1 + (left) and NP+ or NP (middle) activated caspase 3 B220+ B cells 4 wks after immunization. The right FACS plots show a representative overlay of NP-PE staining on B6 and B6.TC B220+ caspase 3+ cells using the gating indicated in the left plot. (A–C) Means and SD of 3–5 mice per strain per time point. These data are representative results of two independent experiments. Filled and open columns represent B6 and B6.TC (indicated as TC) mice, respectively. Asterisks indicate levels of significance of t tests between the two strains at each time point (*: p ≤ 0.05; **: p ≤ 0.01).
Figure 4
Figure 4. NP-KLH-immunized lupus mice produced fewer NP-specific germinal center B cells
Percentage of (A) NP+ (left axis) or NP (right axis) GL7+ B220+ and (B) NP+ IgM+ GL7+ B220+ B cells in B6 (filled symbols) and B6.TC (indicated as TC, open symbols) mice 4 wks post-immunization. Representative FACS plots are shown for each graph. (C) Time course of the anti-NP3/anti-NP23 IgG and IgG1 ratio (serum dilution 1:5,000). Means ± SD of representative results from 2 independent experiments with 3–5 mice per group. Asterisks indicate levels of significance of t tests between the two strains (*: p ≤ 0.05; **: p ≤ 0.01). Stars (⋆) indicate when statistical significance (p ≤ 0.05) was reached for every time point in the graph. Short horizontal lines indicate the mean.
Figure 5
Figure 5. Immunofluorescence staining of B6.TC and B6 spleens after NP-KLH immunization
The majority of (A) NP-specific λ1 + IgM+ cells or (B) λ1 + B220+ cells were located in the B cell zone, concentrated in foci near or in the GL7+ GC in B6 mice. In contrast, these cells were fewer in number and scattered throughout the follicle in B6.TC (indicated by TC) mice. (C) NP-specific λ1 + CD138+ PB / PC were grouped in extra-follicular foci in B6 mice, but were scattered in B6.TC mice.
Figure 6
Figure 6. B6.TC mice produce proportionally fewer NP-specific plasma cells in the spleen and BM
(A) Upper row: NP+ B220lo/− CD138+ PC expressed as percentage of CD138+ splenocytes and absolute numbers. Lower row: total PC expressed as percentage of splenocytes and absolute numbers. (B) NP+ B220lo/− CD138+ PC expressed as percentage of CD138+ BM cells and absolute numbers. (C) Expression of 2.4G2 on NP+ and total (all) B220lo/− CD138+ PC in the spleen and BM. Filled and open symbols represent B6 and B6.TC mice (indicated by TC), respectively. Means ± SD of representative results from 2 independent experiments with 3–5 mice per group, 4 wks after immunization, with representative FACS plots shown on the right. Asterisks indicate levels of significance of t tests between the two strains (*: p ≤ 0.05; **: p ≤ 0.01). Short horizontal lines indicate the mean.
Figure 7
Figure 7. NP-KLH-immunized B6.TC mice produced functionally defective NP-specific ASC
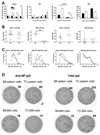
(A) Anti-NP IgG+ (two left panels) and total IgG ASC (two right panels) in the spleen and BM of B6 and B6.TC (indicated as TC) mice were enumerated by ELISPOT and normalized to 106 cells. Means ± SD of representative results from 2 independent experiments with 3–5 mice per strain per time point. (B) Normalized anti-NP (two left panels) and total IgG (two right panels) in supernatants from spleen and BM ASC in B6 (filled symbols) and B6.TC (open symbols) mice one wk post-immunization. Asterisks indicate levels of significance of t tests (*: p ≤ 0.05; **: p ≤ 0.01). (C) ASC diameter distribution calculated on 6 randomly selected wells at the same serial dilution for each strain, with the threshold of detection set at 25 µM for total IgG and 35 µM for αNP IgG. (D) Representative ELISPOT wells at the same serial dilution, showing anti-NP IgG (left) and total IgG (right) ASC in the spleen and BM in B6 and B6.TC mice 4 wks post-immunization illustrating the size difference. The number of spots per well is indicated on the upper right corner. Short horizontal lines indicate the mean.
Figure 8
Figure 8. B6.TC BM did not contain long-lived anti-NP PC
T cell-depleted splenocytes or BM cells obtained from B6 or B6.TC (indicated as TC) mic e 30 wks after immunization were transferred into B6.Rag mice. (A) Anti-NP IgG and (B) total IgG levels were measured 2 wks after transfer. (C) Anti-dsDNA and anti-chromatin IgG was measured 1 wk after transfer (left axis) and the levels of these autoAbs in the donors at transfer are shown on the right axis. The experiment was performed twice with identical results. Asterisks indicate levels of significance of t tests between the two strains at a given dilution (*: p ≤ 0.05; **: p ≤ 0.01; ***: p ≤ 0.001). Short horizontal lines indicate the mean.

Similar articles

Cited by

References

    1. Lipsky PE. Systemic lupus erythematosus: an autoimmune disease of B cell hyperactivity. Nat.Immunol. 2001;2:764–766. - PubMed
    1. Radic MZ, Weigert M. Genetic and structural evidence for antigen selection of anti-DNA antibodies. Ann.Rev.Immunol. 1994;12:487–520. - PubMed
    1. Craft J, Peng S, Fujii T, Okada M, Fatenejad S. Autoreactive T cells in murine lupus- Origins and roles in autoantibody production. Immunologic Research. 1999;19:245–257. - PubMed
    1. Burlingame RW, Rubin RL, Balderas RS, Theofilopoulos AN. Genesis and evolution of antichromatin autoantibodies in murine lupus implicates T-dependent immunization with self antigen. J.Clin.Invest. 1993;91:1687–1696. - PMC - PubMed
    1. William J, Euler C, Christensen S, Shlomchik MJ. Evolution of autoantibody responses via somatic hypermutation outside of germinal centers. Science. 2002;297:2066–2070. - PubMed

Publication types