. 2008 Nov;118(11):3660-70.
doi: 10.1172/JCI36157. Epub 2008 Oct 16.

Notch1 is an effector of Akt and hypoxia in melanoma development

Affiliations

Notch1 is an effector of Akt and hypoxia in melanoma development

Barbara Bedogni et al. J Clin Invest. 2008 Nov.

Abstract

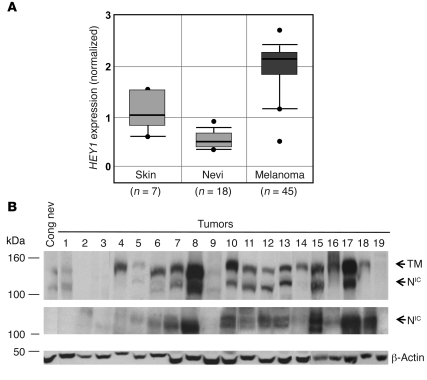
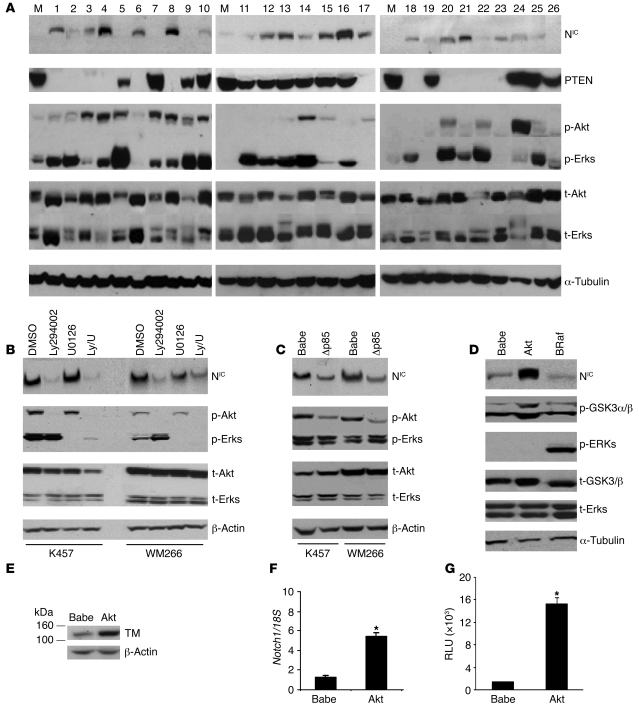
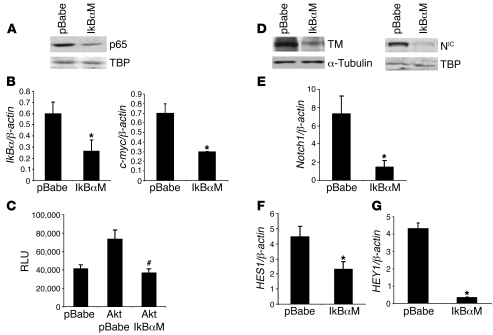
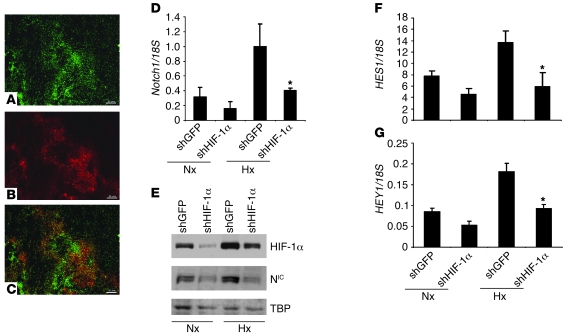
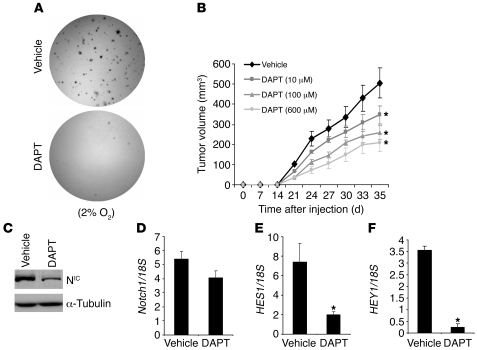
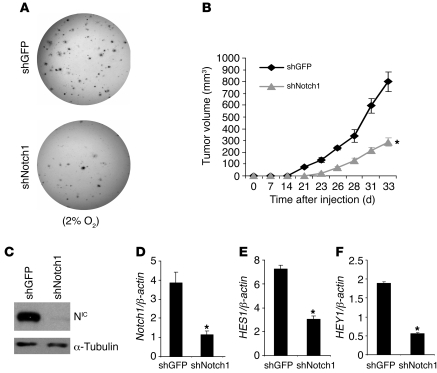
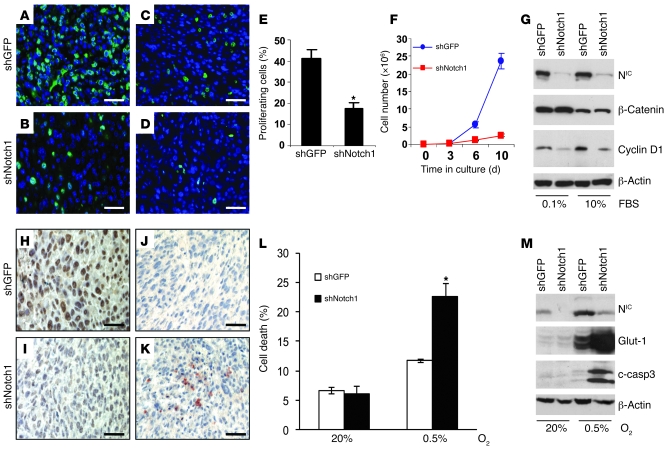
Melanomas are highly aggressive neoplasms resistant to most conventional therapies. These tumors result from the interaction of altered intracellular tumor suppressors and oncogenes with the microenvironment in which these changes occur. We previously demonstrated that physiologic skin hypoxia contributes to melanomagenesis in conjunction with Akt activation. Here we show that Notch1 signaling is elevated in human melanoma samples and cell lines and is required for Akt and hypoxia to transform melanocytes in vitro. Notch1 facilitated melanoma development in a xenograft model by maintaining cell proliferation and by protecting cells from stress-induced cell death. Hyperactivated PI3K/Akt signaling led to upregulation of Notch1 through NF-kappaB activity, while the low oxygen content normally found in skin increased mRNA and protein levels of Notch1 via stabilization of HIF-1alpha. Taken together, these findings demonstrate that Notch1 is a key effector of both Akt and hypoxia in melanoma development and identify the Notch signaling pathway as a potential therapeutic target in melanoma treatment.


Figures

Figure 1
Figure 1. Notch1 is elevated in melanoma.
(A) HEY1 expression levels in normal skin, benign nevi, and primary melanoma tumor samples. Boxes denote interquartile range; lines denote median; whiskers denote first and fourth quartiles, excluding outliers (dots). Melanoma vs. nevi, melanoma vs. skin, and melanoma vs. combined benign samples, P < 0.001; skin vs. nevi, P < 0.005; Student’s t test for all comparisons. (B) Western blot analysis of congenital nevus (Cong nev) and melanoma samples. The double band in the upper panel refers to TM-Notch1 (TM) and Notch1-NIC (NIC). The same samples were also probed with a Notch1-NIC–specific antibody. The β-actin was used as loading control.
Figure 2
Figure 2. Notch1-NIC expression is a function of PI3K/Akt pathway activation and is transcriptionally regulated by Akt.
(A) We analyzed 26 low-passage melanoma cell lines for activation of the PI3K/Akt and Raf/MEK/Erk pathways with respect to normal human melanocytes in correlation with Notch1-NIC. M, melanocytes; p-, phosphorylated; t-, total. (B) Two of the cell lines analyzed in A (WM266, lane 3; K457, lane 8) were treated with 50 μM Ly294002, 10 μM U0126, or the combination (Ly/U). Effectiveness of the treatment was assessed as the inhibition of phosphorylation of Akt and Erk1/2. (C) K457 and WM266 expressing dominant-negative PI3K (Δp85) were assessed for Notch1-NIC protein. (D) Mouse melanocytes overexpressing oncogenic Akt or oncogenic BRaf were assessed for Notch1-NIC expression. The ratio of Notch1-NIC to α-tubulin was 1.3 for Babe, 4.8 for Akt, and 1.2 for BRaf. (E) Western blot for TM-Notch1 showed higher expression in Akt-expressing cells. (F) qRT-PCR for Notch1. As an internal control, 18S was used for normalization. (G) Notch1 activity, measured as induction of a HES1-dependent reporter construct. Data in F and G are mean ± SD. *P < 0.05 versus Babe control, Student’s t test. In AE, α-tubulin and β-actin were used as indicated as loading controls.
Figure 3
Figure 3. Notch1 is transcriptionally regulated by Akt through NF-κB activity.
(A) Western blot analysis for p65 in nuclei of Akt-expressing melanocytes stably transfected with IκBαM. Tata-binding protein (TBP) was used as loading control for nuclear protein lysates. (B) qRT-PCR analysis of cells in A for IκBα and c-myc. (C) NF-κB reporter assay in melanocytes expressing an empty vector (pBabe), Akt, or Akt/IκBαM. (D) Western blot for TM-Notch1 and Notch1-NIC protein in Akt cells expressing either an empty vector (pBabe) or IκBαM. Tata-binding protein and α-tubulin were used as loading controls for nuclear protein lysates and total protein lysates, respectively. (E) qRT-PCR analysis of cells in D for Notch1. (F and G) Notch1 activity measured as induction of HES1 and HEY1 mRNAs by qRT-PCR. Data in B, C, and EG are mean ± SD. *P < 0.05 versus pBabe control; #P < 0.05 versus Akt alone; Student’s t test for all comparisons.
Figure 4
Figure 4. Notch1-NIC colocalizes with hypoxia, and its expression is regulated by HIF-1α.
(AC) Akt-dependent tumors were stained for Notch1-NIC (A) and with the hypoxia marker EF5 (B), showing colocalization (C). Scale bars: 50 μm. (D) qRT-PCR analysis of Akt-expressing melanocytes treated with normoxia (Nx; 21% O2) or hypoxia (Hx; 2% O2) and expressing either shGFP or shHIF-1α. (E) Western blot analysis for HIF-1α and Notch1-NIC in nuclear lysates. Tata-binding protein was used as loading control. (F and G) HES1 and HEY1 expression, as measured by qRT-PCR. As an internal control, 18S was used for normalization. Data in D, F, and G are mean ± SD. *P < 0.05 versus hypoxic control, Student’s t test.
Figure 5
Figure 5. Chemical inhibition of Notch1 activity reduces melanocyte transformation and delays tumor growth.
(A) Akt-expressing melanocytes were seeded in soft agar in the presence of 10 μM DAPT or DMSO vehicle and incubated in hypoxia for 3 wk. Mean ± SD colony numbers were 99 ± 3 for vehicle control and 10 ± 5 for DAPT. (B) Akt-expressing cells were injected s.c. into SCID mice, which were treated topically with vehicle or DAPT (10, 100, or 500 μM) every other day for the duration of the experiment. Shown are mean ± SEM tumor volumes. (C) Western blot for Notch1-NIC in Akt-expressing melanocytes treated with vehicle or 10 μM DAPT. α-Tubulin was used as loading control. (DF) qRT-PCR for Notch1, HES1, and HEY1 on Akt-expressing cells treated with vehicle or 10 μM DAPT. As an internal control, 18S was used to normalize the expression levels of the target genes. Data are mean ± SD. *P < 0.05 versus vehicle control, Student’s t test.
Figure 6
Figure 6. Genetic inhibition of Notch1 reduces melanocyte transformation and tumor growth.
(A) Akt-expressing melanocytes stably transfected with either shNotch1 or the control shGFP were seeded in soft agar in hypoxia for 3 wk. Mean ± SD colony numbers were 81 ± 7 for shGFP and 18 ± 2 for shNotch1. (B) Akt-expressing cells described in A were injected s.c. into SCID mice. Shown are mean ± SEM tumor volumes. (C) Western blot for Notch1-NIC in Akt-expressing melanocytes expressing shGFP or shNotch1. α-Tubulin was used as loading control. (DF) qRT-PCR for Notch1, HES1, and HEY1 was performed on the cells described in A. Data are mean ± SD. As an internal control, β-actin was used to normalize the expression levels of the target genes. *P < 0.05 versus shGFP control, Student’s t test.
Figure 7
Figure 7. Notch1 inhibition reduces cell proliferation and increases cell death both in vitro and in vivo.
(AD) Tumor sections from Akt-dependent melanomas expressing a control shGFP (A) or shNotch1 (B) were stained with anti Ki67, and were counterstained with DAPI, to label proliferating cells. (C and D) Adjacent sections stained with anti–cyclin D1 antibody. (E) Quantification of proliferating cells in A and B, shown as percent positive cells in 5 microscopic fields from 3 different tumor sections per group. (F) Melanocytes expressing either shGFP or shNotch1 were grown in culture and counted every 3–4 d. (G) Western blot analysis for Notch1-NIC, β-catenin, and cyclin D1 of cells transfected with shGFP or shNotch1. β-Actin was used as loading control. (HK) Tumor sections from cells expressing shGFP (H) or shNotch1 (I) were stained for Notch1-NIC. (J and K) Adjacent sections were stained with anti–cleaved caspase-3. (L) Quantification of cell death under stringent hypoxia (0.5% O2), measured as positivity to annexin V/propidium iodide. (M) Western blot analysis for Notch1-NIC and cleaved caspase-3 (c-casp3) on cells grown in normoxia or stringent hypoxia for 48 h. Glut-1 was included as an indicator of the hypoxia treatment. β-Actin was used as loading control. Data in E, F, and L are mean ± SD. *P < 0.05 versus respective shGFP control, Student’s t test. Scale bars: 25 μm.

References

    1. Demunter A., Stas M., Degreef H., De Wolf-Peeters C., van den Oord J.J. Analysis of N- and K-ras mutations in the distinctive tumor progression phases of melanoma. J. Invest. Dermatol. 2001;117:1483–1489. doi: 10.1046/j.0022-202x.2001.01601.x. - DOI - PubMed
    1. Davies H., et al. Mutations of the BRAF gene in human cancer. Nature. 2002;417:949–954. doi: 10.1038/nature00766. - DOI - PubMed
    1. Stahl J.M., et al. Deregulated Akt3 activity promotes development of malignant melanoma. Cancer Res. 2004;64:7002–7010. doi: 10.1158/0008-5472.CAN-04-1399. - DOI - PubMed
    1. Cannon-Albright L.A., Kamb A., Skolnick M. A review of inherited predisposition to melanoma. Semin. Oncol. 1996;23:667–672. - PubMed
    1. Artavanis-Tsakonas S., Rand M.D., Lake R.J. Notch signaling: cell fate control and signal integration in development. Science. 1999;284:770–776. doi: 10.1126/science.284.5415.770. - DOI - PubMed

Publication types

MeSH terms