. 2008 Nov;118(11):3639-50.
doi: 10.1172/JCI35834. Epub 2008 Oct 1.

The kinetics of CD4+Foxp3+ T cell accumulation during a human cutaneous antigen-specific memory response in vivo

Affiliations

The kinetics of CD4+Foxp3+ T cell accumulation during a human cutaneous antigen-specific memory response in vivo

Milica Vukmanovic-Stejic et al. J Clin Invest. 2008 Nov.

Abstract

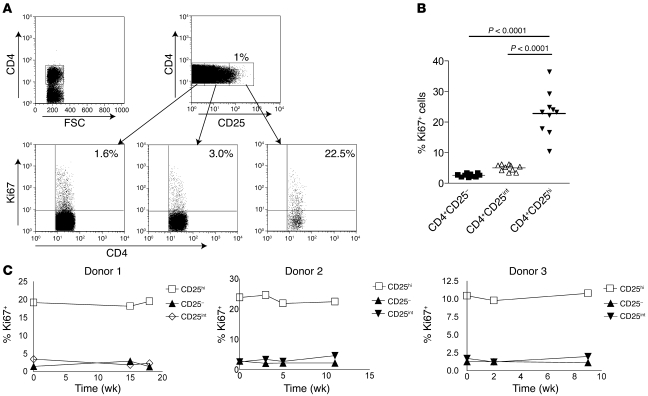
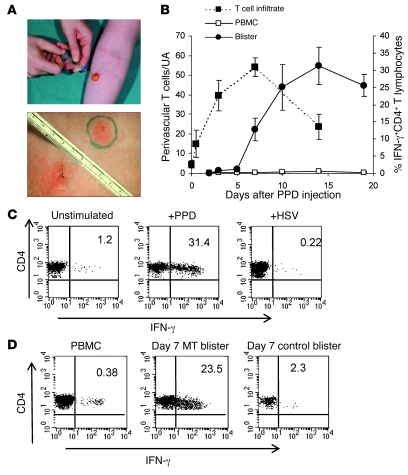
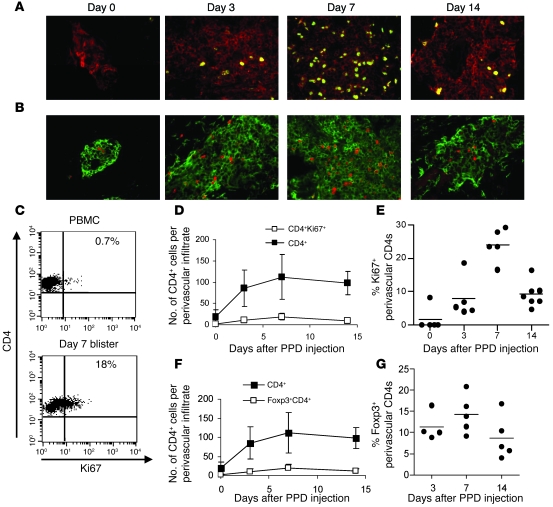
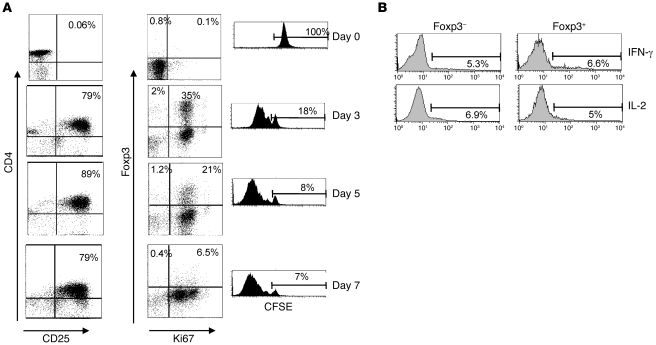
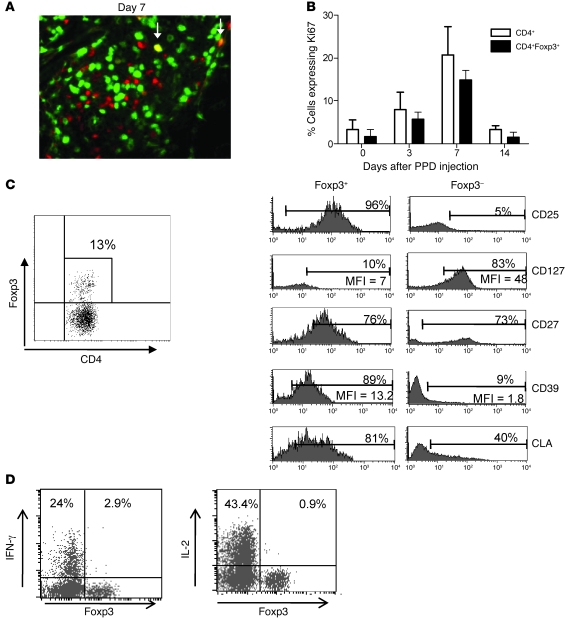
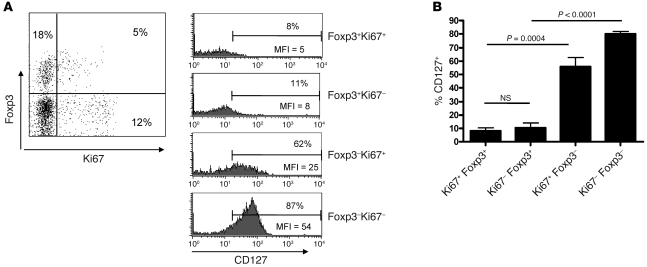
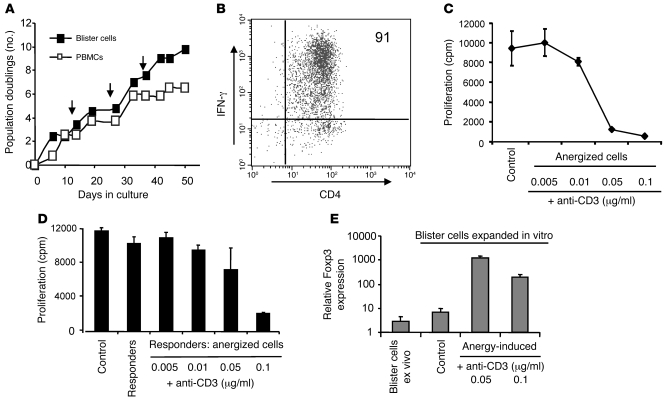
Naturally occurring CD4(+)CD25(hi)Foxp3(+) Tregs (nTregs) are highly proliferative in blood. However, the kinetics of their accumulation and proliferation during a localized antigen-specific T cell response is currently unknown. To explore this, we used a human experimental system whereby tuberculin purified protein derivative (PPD) was injected into the skin and the local T cell response analyzed over time. The numbers of both CD4(+)Foxp3(-) (memory) and CD4(+)Foxp3(+) (putative nTreg) T cells increased in parallel, with the 2 populations proliferating at the same relative rate. In contrast to CD4(+)Foxp3(-) T cell populations, skin CD4(+)Foxp3(+) T cells expressed typical Treg markers (i.e., they were CD25(hi), CD127(lo), CD27(+), and CD39(+)) and did not synthesize IL-2 or IFN-gamma after restimulation in vitro, indicating that they were not recently activated effector cells. To determine whether CD4(+)Foxp3(+) T cells in skin could be induced from memory CD4(+) T cells, we expanded skin-derived memory CD4(+) T cells in vitro and anergized them. These cells expressed high levels of CD25 and Foxp3 and suppressed the proliferation of skin-derived responder T cells to PPD challenge. Our data therefore demonstrate that memory and CD4(+) Treg populations are regulated in tandem during a secondary antigenic response. Furthermore, it is possible to isolate effector CD4(+) T cell populations from inflamed tissues and manipulate them to generate Tregs with the potential to suppress inflammatory responses.


Figures

Figure 1
Figure 1. Human CD4+CD25hi Tregs turn over rapidly in vivo.
Freshly isolated PBMCs from healthy individuals were stained for CD4/CD25/CD127/Foxp3 and Ki67 following the standard protocol. Tregs were identified as CD25hi, Foxp3+, and CD127lo (for details, see Supplemental Figure 1). (A) Expression of Ki67 on CD4+CD25hi, CD4+CD25int, and CD4+CD25 cells from a representative sample. Numbers denote the percentage of cells expressing Ki67 relative to the control gate set with an irrelevant antibody. FSC, forward scatter. (B) Cumulative data showing the percentage of Ki67+ cells in each subset. Each symbol represents a different individual (n = 10 per group), and the mean percentage is shown as a horizontal line. Significance was determined by paired t test. (C) Graphs show expression of Ki67 in Treg and non-Treg populations examined over the course of 4 months in 3 individuals.
Figure 2
Figure 2. The MT is a well-characterized model of a memory immune response.
Samples were collected between 0 and 19 days after PPD injection. (A) Skin biopsies were collected for immunohistochemistry (top panel), and cutaneous lymphocytes were isolated from skin suction blisters that were induced over the sites of PPD injection at different time points (lower panel). (B) PPD-specific memory T cells accumulate during the course of MT. PBMCs and blister cells were stimulated with PPD for 15 hours in the presence of Brefeldin A and stained for intracellular expression of IFN-γ (right y axis, solid lines). The number of CD3+ T cells within dermal perivascular infiltrates was determined by indirect immunoperoxidase staining of 5-μm tissue sections. The 5 largest perivascular infiltrates were counted and data presented per unit area (UA). The mean ± SEM of 5 individuals per time point is shown (dashed line, left y axis). (C) Blister cells recovered from day 7 blisters were stimulated with PPD or with irrelevant antigen (HSV, CMV, tetanus) or left unstimulated and stained for intracellular expression of IFN-γ. Representative dot plots (n = 3 samples per antigen) are shown. Numbers denote the percentage of cells expressing IFN-γ. (D) IFN-γ production from day 7 blisters raised over MT response or the site of the control (saline) injection. Numbers denote the percentage of cells expressing IFN-γ. PBMCs and blister cells (PPD and control) from the same donor were stimulated with PPD overnight as described in Methods.
Figure 3
Figure 3. Antigen-specific memory CD4+ T cell proliferation at the site of the MT.
(A) Double immunofluorescence staining of representative biopsies from days 0, 3, 7, and 14 following MT induction. Green indicates Ki67; red indicates CD4. Original magnification, ×400. (B) Double immunofluorescence staining of representative biopsies (days 0, 3, 7, and 14; n = 5 per time point) shows CD4+ (green) and Foxp3+ (red) cells in a perivascular lymphocytic infiltrate (original magnification, ×400). The 5 largest perivascular infiltrates present in the upper and middle dermis were selected for analysis. Cell numbers were expressed as the mean absolute number of cells counted within the frame. (C) The proportion of Ki67+CD4+ cells was also determined by flow cytometry using blister cells (n = 3–5 per time point). Representative dot plots for day 7 PPD blister cells and PBMCs are shown. Numbers denote the percentage of cells expressing Ki67 relative to control gate set with an irrelevant antibody. (D) Number of total CD4+ cells (filled squares) and number of Ki67+CD4+ cells (open squares) in perivascular infiltrates following PPD injection. (E) Percentage of CD4+ cells expressing Ki67 found per perivascular infiltrate in each donor. Each circle represents an average of 5 perivascular infiltrates counted for each individual (n = 5–7 per time point; horizontal lines indicate the mean). (F) Number of total CD4+ cells (filled squares) and CD4+Foxp3+ cells (open squares) in perivascular infiltrates following PPD injection. (G) Percentage of CD4+ cells expressing Foxp3 per perivascular infiltrate counted. Each symbol represents an average of 5 perivascular infiltrates counted for each individual (n = 5–7 per time point). Data are mean ± SEM.
Figure 4
Figure 4. Induction of Foxp3 expression in human CD4+CD25 T cells by stimulation.
(A) CD4+CD25 (responder) T cells were isolated from PBMCs using MACS and labeled with CFSE. Cells were stimulated with magnetic beads coated with antibodies to CD3 and CD28 for 7 days. Samples were removed at regular intervals and stained for the expression of CD25, Foxp3, and Ki67. Numbers in dot plots indicate the percentage of cells in each quadrant. Dilution of the CFSE signal indicates proliferation of the cells. Percentages refer to cells that have not divided. Data shown are representative of 3 independent experiments. (B) Cells were removed from CD3/CD28-stimulated cultures on day 4 and restimulated with PMA and ionomycin before staining for Foxp3, IL-2, and IFN-γ. Histograms show cytokine production by Foxp3 and Foxp3+ cells and are representative of 3 independent experiments. Numbers indicate the percentage of cells expressing IL-2 or IFN-γ.
Figure 5
Figure 5. Foxp3+ T cells have a Treg phenotype and proliferate at the site of an immune response.
(A) Double immunofluorescence staining of Ki67 (green) and Foxp3 (red) in a representative day 7 skin section (original magnification, ×400). Arrows indicate cells staining positive for both Ki67 and Foxp3 (yellow). (B) Graph shows the percentage of CD4+ (white bars) and CD4+Foxp3+ (black bars) cells expressing Ki67. Data are mean ± SD; n = 5 per time point. (C) Blister cells were isolated on day 7 following MT induction and stained for Foxp3, CD127, CD25, CD27, and CD39. Representative staining (n = 6) is shown. Dot plot indicates the gating strategy, and histograms show the expression of surface molecules on CD4+Foxp3+ and CD4+Foxp3 subsets. MFI and percentage of positive cells are indicated. CLA, cutaneous lymphocyte antigen. (D) Blister cells were isolated on day 7 following MT induction, stimulated with PPD for 15 hours in the presence of brefeldin A, and stained for intracellular expression of cytokines and Foxp3. The percentage of Foxp3+ and Foxp3 cells secreting cytokines is indicated. Dot plots are representative of 4–6 independent experiments.
Figure 6
Figure 6. Proliferating Foxp3+ T cells in the skin express low levels of CD127.
Blister cells were isolated on day 7 following MT induction and stained for CD4, Foxp3, CD127, and Ki67. Representative staining (n = 6) is shown. (A) Dot plot indicates gating strategy. The percentage of cells in each quadrant is indicated. Histograms show the expression of CD127 on CD4+Foxp3+ and CD4+Foxp3 subsets divided by Ki67 expression. Numbers indicate the percentage of cells expressing CD127. (B) Cumulative data comparing Foxp3+Ki67+ and Foxp3+Ki67 subsets. P values were calculated using a paired t test. Data are mean ± SEM.
Figure 7
Figure 7. Anergy induction leads to the development of a suppressive phenotype.
(A) Cells recovered from a suction blister induced over a MT site 21 days following the induction were stimulated in vitro with PPD every 14 days (indicated by arrows). Peripheral blood CD4+ T cells from the same donor were cultured in parallel. (B) Dot plot shows IFN-γ production by the cell line in response to PPD stimulation. The percentage of cells expressing IFN-γ is indicated. (C) PPD-specific CD4+ T cell line was stimulated with immobilized anti-CD3 mAb. The cells were then washed and stimulated with PPD and antigen-presenting cells for 3 days, and proliferation was measured by [3H]-thymidine incorporation. The mean of triplicate wells ± SEM is shown (representative of 3 separate experiments). PPD-specific CD4+ T cells that were not anergized were used as control. (D) Anergized PPD-specific cells described in C were mixed with an equal number of autologous non-anergized PPD-specific cells and stimulated with PPD and autologous antigen-presenting cells. Proliferation was measured on day 3 and is expressed as mean ± SEM. Responders, non-anergized PPD cell lines cultured alone; control, responders with non-anergized PPD-specific cells. Results are representative of 2 separate experiments. (E) Foxp3 expression was measured by real-time quantitative RT-PCR using 18s rRNA as an internal control. Relative quantity values are plotted in a log-scale bar chart using the triplicate values to estimate SD. Cells recovered from the blister are indicated as “blister cells ex vivo.” Blister cells expanded in vitro prior to anergy induction were used as a control.

References

    1. Shevach E.M. CD4+ CD25+ suppressor T cells: more questions than answers. Nat. Rev. Immunol. 2002;2:389–400. - PubMed
    1. Sakaguchi S. Naturally arising CD4+ regulatory t cells for immunologic self-tolerance and negative control of immune responses. Annu. Rev. Immunol. 2004;22:531–562. doi: 10.1146/annurev.immunol.21.120601.141122. - DOI - PubMed
    1. Coombes J.L., Robinson N.J., Maloy K.J., Uhlig H.H., Powrie F. Regulatory T cells and intestinal homeostasis. Immunol.Rev. 2005;204:184–194. doi: 10.1111/j.0105-2896.2005.00250.x. - DOI - PubMed
    1. Belkaid Y. Regulatory T cells and infection: a dangerous necessity. Nat. Rev. Immunol. 2007;7:875–888. doi: 10.1038/nri2189. - DOI - PubMed
    1. Apostolou I., von Boehmer H. In vivo instruction of suppressor commitment in naive T cells. J. Exp. Med. 2004;199:1401–1408. doi: 10.1084/jem.20040249. - DOI - PMC - PubMed

Publication types

MeSH terms