. 2008 Dec 20;511(6):753-72.
doi: 10.1002/cne.21869.

Types of taste circuits synaptically linked to a few geniculate ganglion neurons

Affiliations

Types of taste circuits synaptically linked to a few geniculate ganglion neurons

Faisal N Zaidi et al. J Comp Neurol. .

Abstract

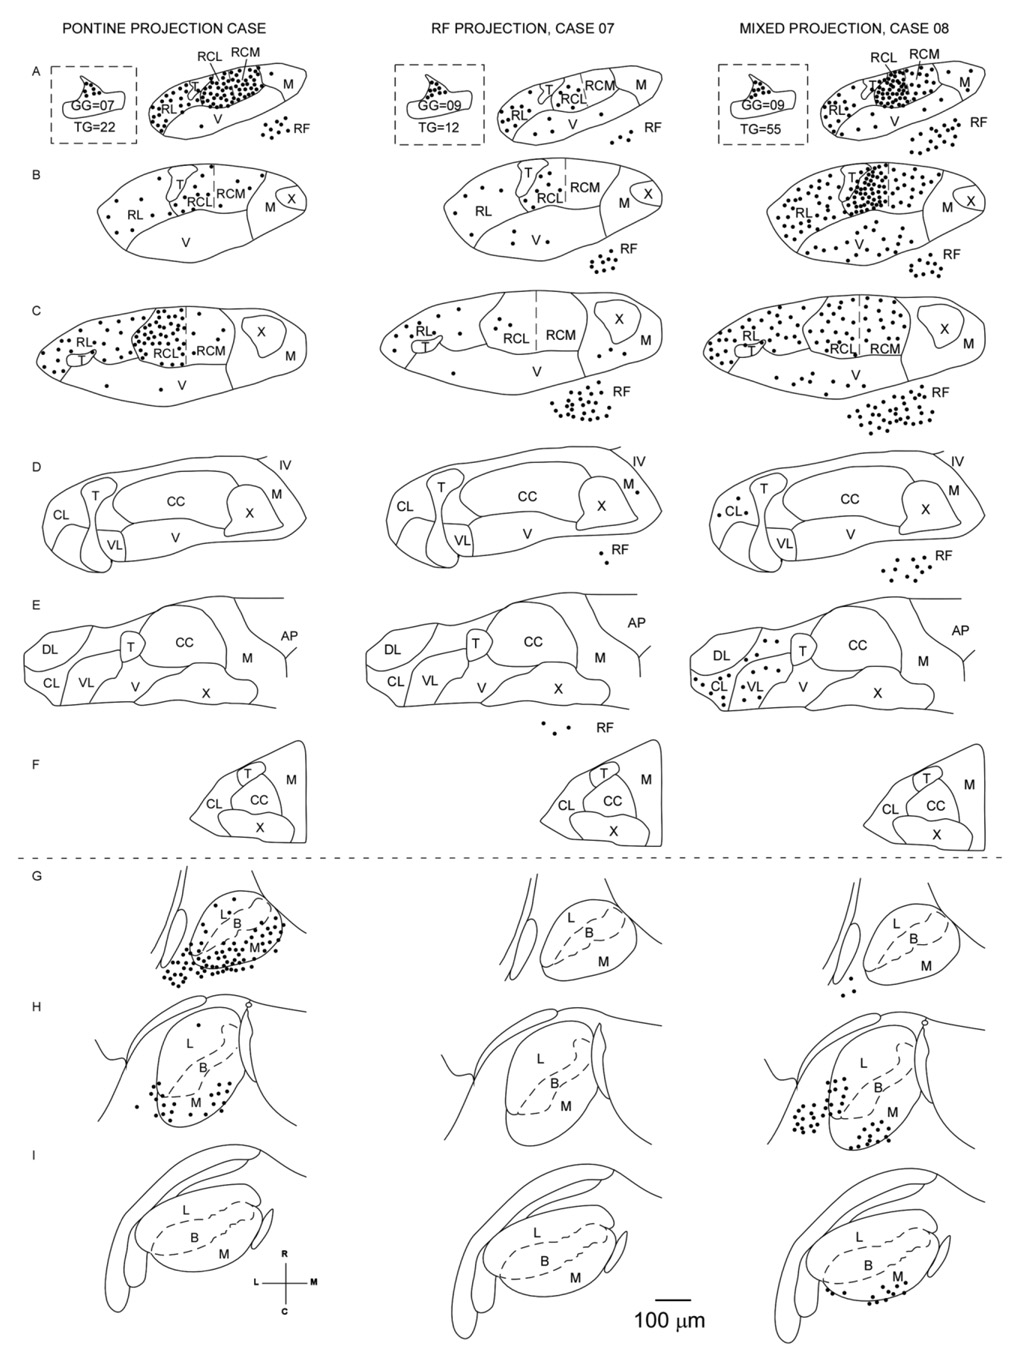
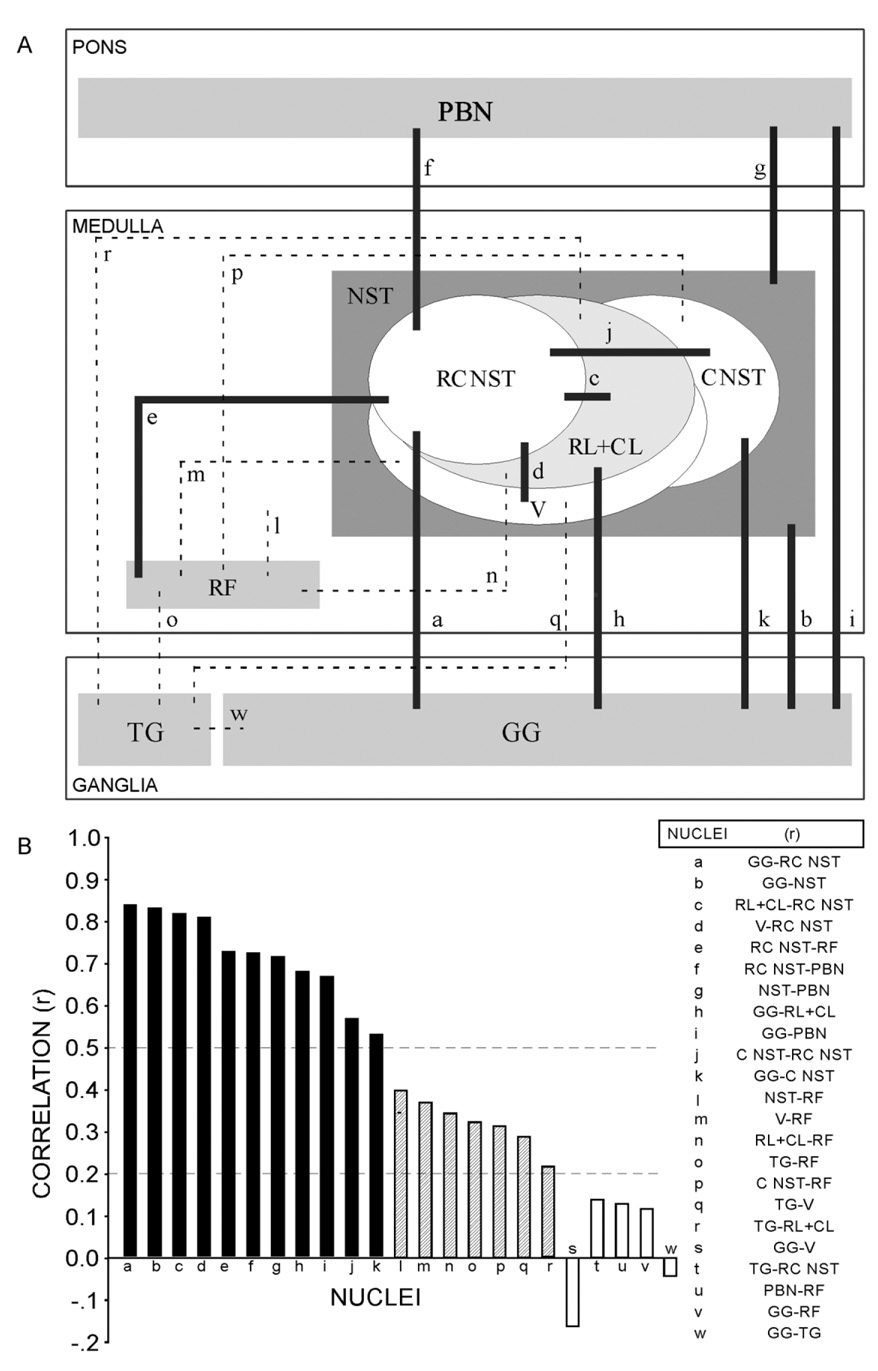
The present study evaluates the central circuits that are synaptically engaged by very small subsets of the total population of geniculate ganglion cells to test the hypothesis that taste ganglion cells are heterogeneous in terms of their central connections. We used transsynaptic anterograde pseudorabies virus labeling of fungiform taste papillae to infect single or small numbers of geniculate ganglion cells, together with the central neurons with which they connect, to define differential patterns of synaptically linked neurons in the taste pathway. Labeled brain cells were localized within known gustatory regions, including the rostral central subdivision (RC) of the nucleus of the solitary tract (NST), the principal site where geniculate axons synapse, and the site containing most of the cells that project to the parabrachial nucleus (PBN) of the pons. Cells were also located in the rostral lateral NST subdivision (RL), a site of trigeminal and sparse geniculate input, and the ventral NST (V) and medullary reticular formation (RF), a caudal brainstem pathway leading to reflexive oromotor functions. Comparisons among cases, each with a random, very small subset of labeled geniculate neurons, revealed "types" of central neural circuits consistent with a differential engagement of either the ascending or the local, intramedullary pathway by different classes of ganglion cells. We conclude that taste ganglion cells are heterogeneous in terms of their central connectivity, some engaging, predominantly, the ascending "lemniscal," taste pathway, a circuit associated with higher order discriminative and homeostatic functions, others engaging the "local," intramedullary "reflex" circuit that mediates ingestion and rejection oromotor behaviors.


Figures

Fig. 1
Fig. 1
Numbers of virus-labeled ganglion cells differ from case to case. A–C: Cases with a single cell labeled in the geniculate ganglion (some outlined by dashes). D–G: Increasing numbers of labeled geniculate neurons in other cases. The greater petrosal nerve in A–G is indicated (asterisks). H,I: Labeled trigeminal ganglion cells in the mandibular division (asterisks). Scale bars = 50 µm.
Fig. 2
Fig. 2
Virus-labeled neurons in taste-related areas of the rostral medulla in cases with labeled geniculate and trigeminal ganglion cells. A: Labeled cells are concentrated in the nucleus of the solitary tract (NST; oval outline). Labeled cells are also present in the reticular formation (dashed square) and spinal trigeminal sensory nucleus, including the paratrigeminal islands (dashed circle). B: High-magnification view of labeled cells in the rostral NST concentrated in the rostral central (RC) and rostral lateral (RL) subdivisions. C: The rostral NST from a case different from that depicted in B showing many labeled cells in the lateral (RCL) and medial (RCM) halves of the rostral central subdivision. Fewer labeled cells are present in the rostral lateral (RL) and ventral (V) subdivisions; only two cells are labeled in the medial (M) subdivision. D: Nissl-stained section of the rostral NST, level comparable to that depicted in C. Cytoarchitectonic features include desnsely packed small cells in RC, sparse cellularity in M and RL, larger cells in V (Ganchrow et al., 2007; image from the Allen Brain Atlas, BrainMaps.org, Mus musculus, Nissl, coronal, data set 43, C57-C2a, section m17c). For letters not defined see list of Abbreviations. Scale bars = 100 µm.
Fig. 3
Fig. 3
A,C: Labeled cells in the caudal NST (arrows) located in the caudal central (CC) subdivision. B: Nissl-stained section of the caudal NST comparable to that in A. Cytoarchitectonic features (Ganchrow et al., 2007) include dense cellularity of CC medial to the solitary tract (T), sparse cellularity of the medial (M) subdivision, and large cells of the ventrolateral (VL) subdivision (from the Allen Brain Atlas, Brain-Maps.org, Mus musculus, Nissl, coronal, data set 43, C57-C2a, section m18e). D: Fluorescent “Nissl green” counterstain of the same section as in C showing the location of T and the boundaries of CC, M, and area postrema (AP). E,F: Labeled cells (arrows) in the pontine para-brachial nucleus comlex are located medial (E) or ventrolateral (F) to the brachium conjunctivum (BC, dashed outline). The medial (M) and lateral (L) divisions of the PBN are indicated. Cells in the locus ceruleus (LC) are autofluorescent. For letters not defined see list of Abbreviations. Scale bars = 100 µm in B (applies to A–D); 100 µm in E,F.
Fig. 4
Fig. 4
Brain cells labeled in three cases, each with a singlegeniculate ganglion cell labeled. Each case has labeled cells in the NST-RC, and in the PBN-M (see list of Abbreviations). Differences between cases: cases 1 and 2 have cells in RF; cases 2 and 3 have cells in V; case 2, only, has cells in the caudal NST-CC. Case 2 has the greatest number of labeled cells in the trigeminal ganglion and in NST-RL.
Fig. 5
Fig. 5
Left: Case 4. Trigeminal ganglion labeling of many cells (but none in the geniculate ganglion) results in NST labeling primarily in RL, with no PBN labeling. Right: Case 5. Geniculate ganglion labeling of many cells results in labeling in NST (RC, especially), in RF, and in the PBN.
Fig. 6
Fig. 6
Three different cases (6, 7, and 8), each with a similar small population of geniculate ganglion cells labeled, differ in the extent of local (NST and RF) and lemniscal (PBN) central circuits labeled. Case 6 had many cells labeled in the medial PBN. Case 7 had considerable RF labeling but no cells labeled in the PBN. Case 8 had significant labeling in both the RF and PBN, and, uniquely, labeled cells in the caudal NST (E).
Fig. 7
Fig. 7
Summary of all cases grouped according to their “types” of central circuits labeled. A: Trigeminal ganglion cell cases: central NST labeling, when present, includes cells in RL and V, but not the pons (dashed column, all cases). B: Geniculate ganglion cell cases with central, multisynaptic labeling leading predominantly to the RF. C: Geniculate ganglion cell cases with central, multisynaptic labeling leading predominantly to the pons. D: Geniculate ganglion cell cases with mixed pontine and RF circuits. E: Single-labeled geniculate ganglion cell cases (enclosed by heavy lines), compared with pontine-and mixed-projection multiple geniculate ganglion cases. Note: Case 22 is positioned below the RF cases for layout purposes; it resembles the pontine-projection cases.
Fig. 8
Fig. 8
Relationship between the number of labeled ganglion cells and the number of labeled brain cells, by brain region and by prominent NST subdivisions. A,B: On average, for each GG cell labeled, 32 cells are labeled in the medulla (14 in the NST-RC), six in the pons. C,D: Increases in GG cell numbers relate systematically to increases in NST-RC, PBN, and all cells in the medulla and pons. E: Increases in labeled GG cells are not related to increases in numbers of labeled TG or caudal NST cells. F: Increases in TG cells are related to NST-RL and NST-CL increases.
Fig. 9
Fig. 9
Strong correlations (heavy lines in A, see corresponding r values in B) are between GG labeling and labeling of several NST subdivisions, especially RC. RC labeling is strongly correlated with labeling of V, RF, and caudal NST. PBN labeling is strongly correlated with labeling of NST-RC, of NST generally, and of GG.
Fig. 10
Fig. 10
A,B: Cells virally labeled in NST-RC (pseudocolored magenta) and subsequently filled with Lucifer yellow (pseudocolored green) are of three types. D–F: Elongate morphological type (e). G–I: Stellate type (s). J–L: Tufted type (t). Similar to cells in NST-RC of hamster (Whitehead, 1988) and rat (Renehan et al., 1994). B: Several cells of each type were doubly labeled. C: Proportion of cell types sampled. Scale bars = 10 µm.
Fig. 11
Fig. 11
Two different circuits synaptically engaged by ganglion cell inputs. Large circles represent the locations and relative numbers of virus-labeled cells in the circuit that predominantly contributes either to the “ascending lemniscal” taste pathway (red) or to the “local reflex” pathway (blue). Geniculate ganglion cells in mouse innervate a single taste bud in the periphery. Centrally, some ganglion cells synapse (small circles at ends of axon branches) in the rostral central subdivision (RC) of the NST with many PBN-projection neurons, the axons of which, in turn, synapse with somewhat fewer cells in the parabrachial nucleus. Other ganglion cells synapse in RC-NST with intramedullary projection neurons, the axons of which synapse with neurons in the preoromotor brainstem reticular formation.

References

    1. Atema J. Structures and functions of the sense of taste in the catfish (Ictalurus natalis) Brain Behav Evol. 1971;4:273–294. - PubMed
    1. Beckman ME, Whitehead MC. Intramedullary connections of the rostral nucleus of the solitary tract in the hamster. Brain Res. 1991;557:265–279. - PubMed
    1. Bradley RM, Fukami H, Suwabe T. Neurobiology of the gustatory-salivary reflex. Chem Senses. 2005;30:70–71. - PubMed
    1. Brittle EE, Reynolds AE, Enquist LW. Two modes of pseudorabies virus neuroinvasion and lethality in mice. J Virol. 2004;78:12951–12963. - PMC - PubMed
    1. Card JP, Enquist CW. Transneuronal circuit analysis with pseudorabies viruses. Curr Protoc Neurosci. 1999 Suppl 9:1–27. Unit 1. - PMC - PubMed

Publication types

MeSH terms