

Tumor volume in subcutaneous mouse xenografts measured by microCT is more accurate and reproducible than determined by 18F-FDG-microPET or external caliper
- PMID: 18925932
- PMCID: PMC2575188
- DOI: 10.1186/1471-2342-8-16
Tumor volume in subcutaneous mouse xenografts measured by microCT is more accurate and reproducible than determined by 18F-FDG-microPET or external caliper
Abstract
Background: In animal studies tumor size is used to assess responses to anticancer therapy. Current standard for volumetric measurement of xenografted tumors is by external caliper, a method often affected by error. The aim of the present study was to evaluate if microCT gives more accurate and reproducible measures of tumor size in mice compared with caliper measurements. Furthermore, we evaluated the accuracy of tumor volume determined from 18F-fluorodeoxyglucose (18F-FDG) PET.
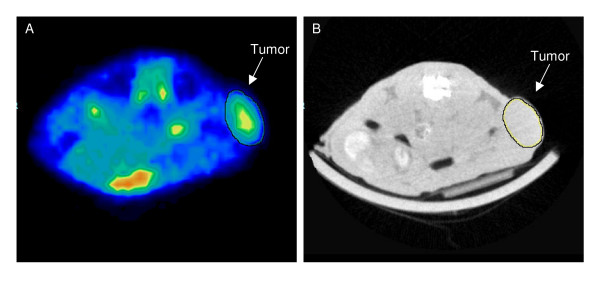
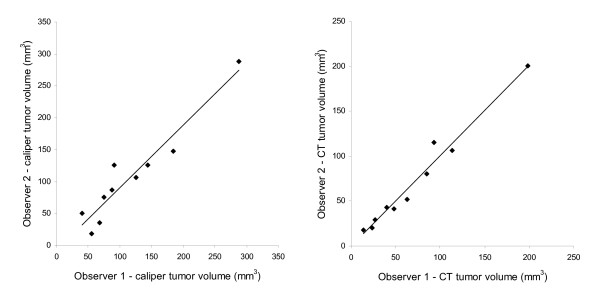
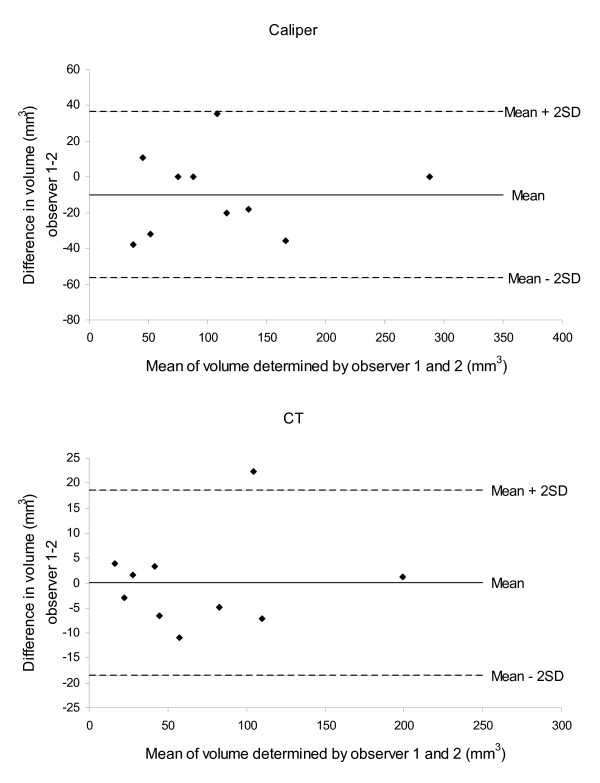
Methods: Subcutaneously implanted human breast adenocarcinoma cells in NMRI nude mice served as tumor model. Tumor volume (n = 20) was determined in vivo by external caliper, microCT and 18F-FDG-PET and subsequently reference volume was determined ex vivo. Intra-observer reproducibility of the microCT and caliper methods were determined by acquiring 10 repeated volume measurements. Volumes of a group of tumors (n = 10) were determined independently by two observers to assess inter-observer variation.
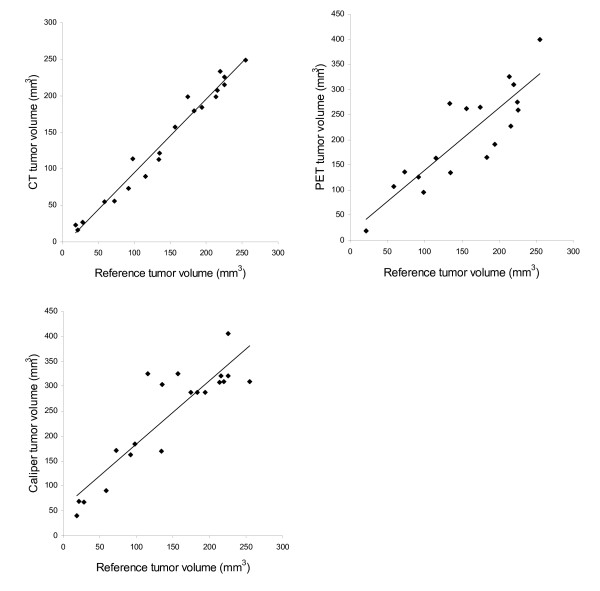
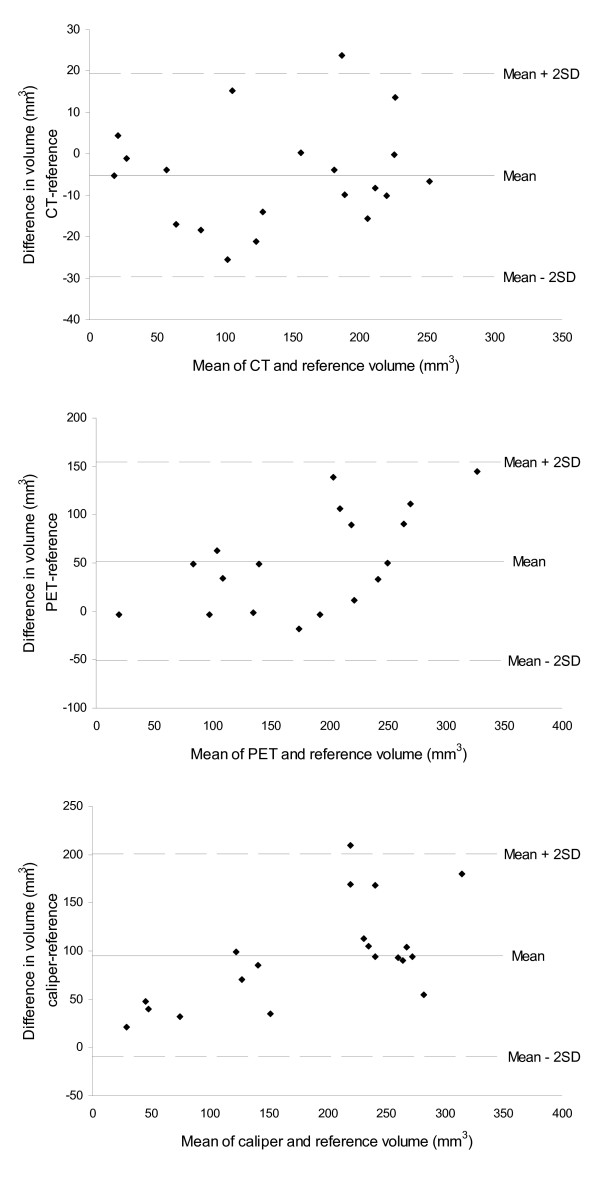
Results: Tumor volume measured by microCT, PET and caliper all correlated with reference volume. No significant bias of microCT measurements compared with the reference was found, whereas both PET and caliper had systematic bias compared to reference volume. Coefficients of variation for intra-observer variation were 7% and 14% for microCT and caliper measurements, respectively. Regression coefficients between observers were 0.97 for microCT and 0.91 for caliper measurements.
Conclusion: MicroCT was more accurate than both caliper and 18F-FDG-PET for in vivo volumetric measurements of subcutaneous tumors in mice.18F-FDG-PET was considered unsuitable for determination of tumor size. External caliper were inaccurate and encumbered with a significant and size dependent bias. MicroCT was also the most reproducible of the methods.
Figures
References
-
- Tomayko MM, Reynolds CP. Determination of subcutaneous tumor size in athymic (nude) mice, Cancer Chemother. Pharmacol. 1989;24:148–154. - PubMed
-
- Leyton J, Alao JP, Da CM, Stavropoulou AV, Latigo JR, Perumal M, Pillai R, He Q, Atadja P, Lam EW, Workman P, Vigushin DM, Aboagye EO. In vivo biological activity of the histone deacetylase inhibitor LAQ824 is detectable with 3'-deoxy-3'-[18F]fluorothymidine positron emission tomography. Cancer Res. 2006;66:7621–7629. doi: 10.1158/0008-5472.CAN-05-3962. - DOI - PubMed
Publication types
MeSH terms
Substances
LinkOut - more resources
Full Text Sources
Other Literature Sources
Medical
