Comparative Study
. 2008 Oct;68(4):737-44.
doi: 10.1016/j.gie.2008.05.018.

High-resolution imaging in Barrett's esophagus: a novel, low-cost endoscopic microscope

Affiliations
Comparative Study

High-resolution imaging in Barrett's esophagus: a novel, low-cost endoscopic microscope

Timothy J Muldoon et al. Gastrointest Endosc. 2008 Oct.

Abstract

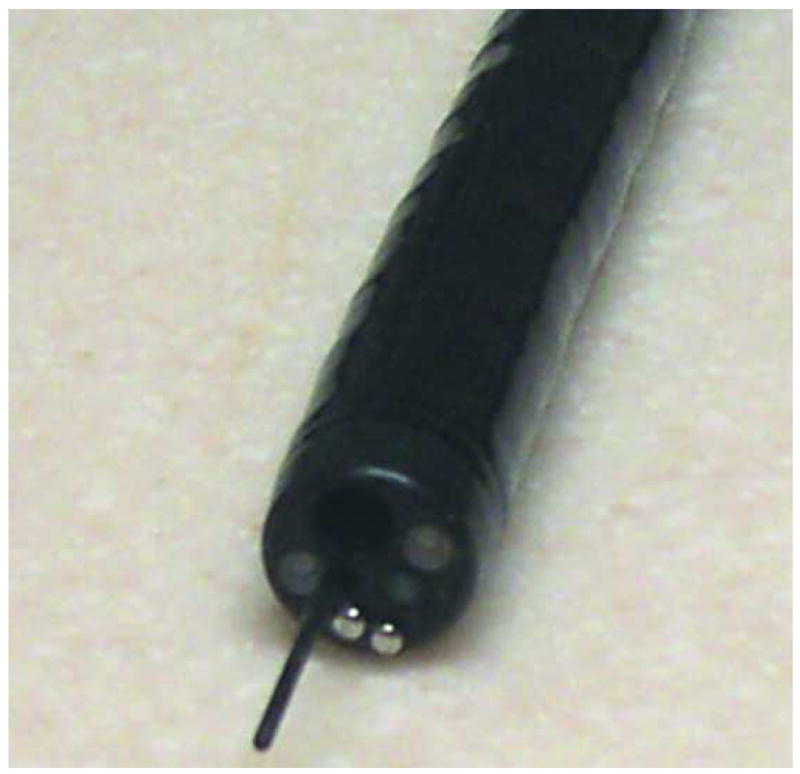
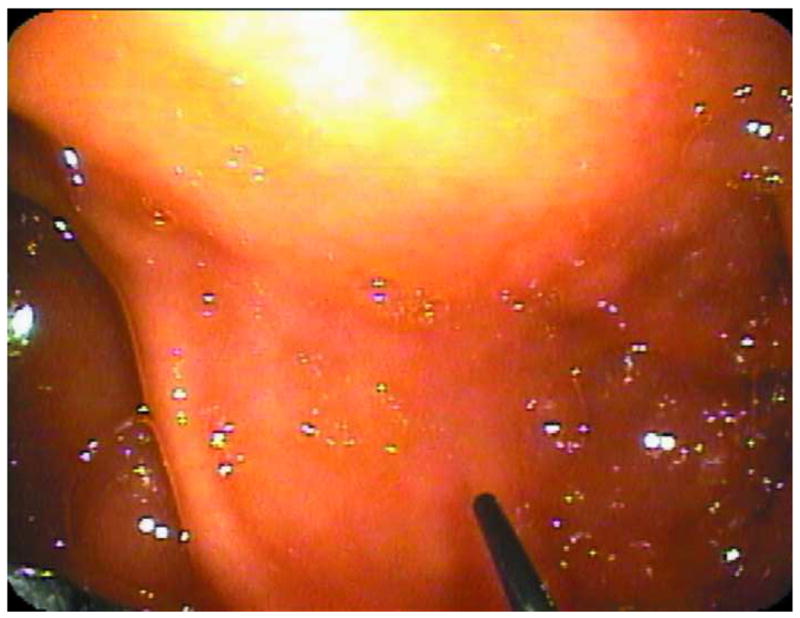
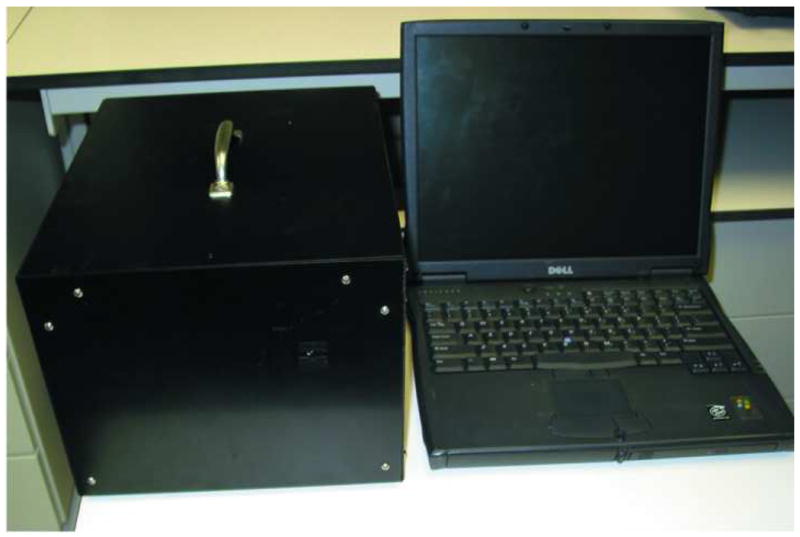
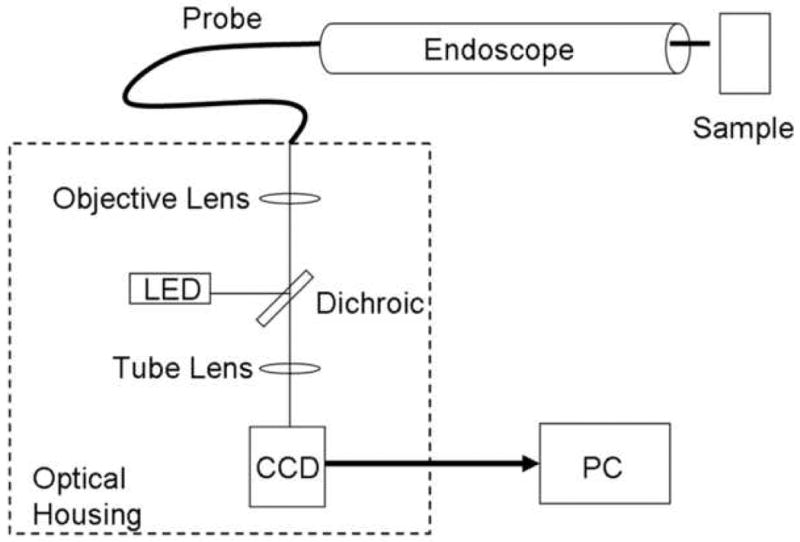
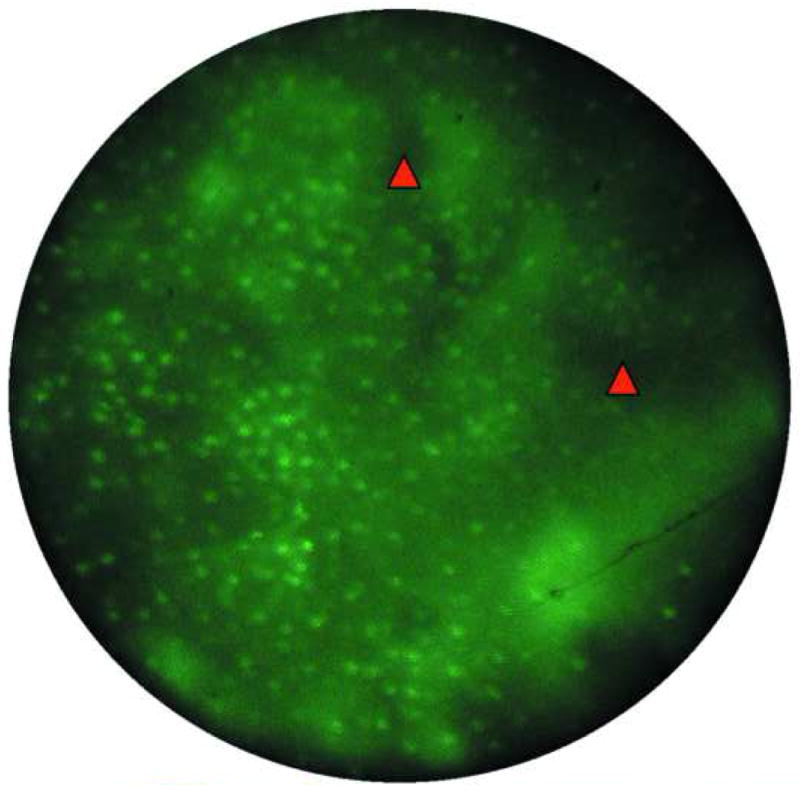
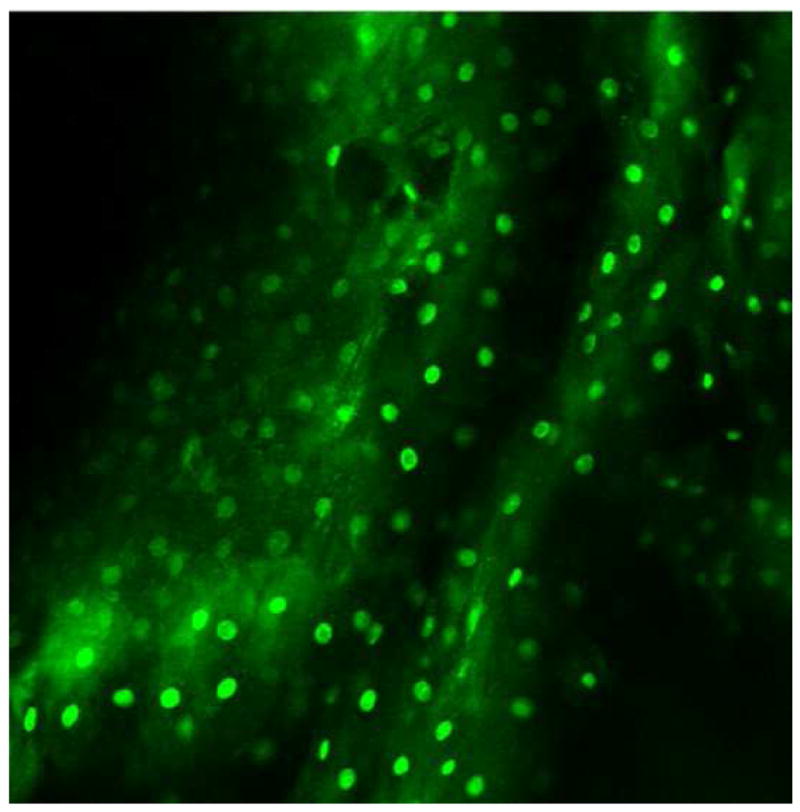
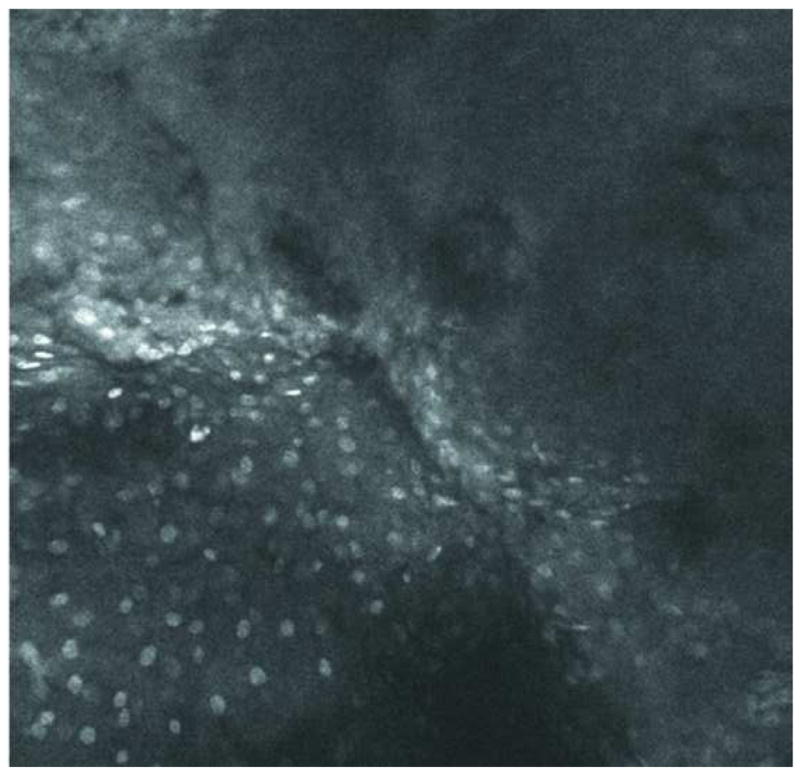
Background: This report describes the clinical evaluation of a novel, low-cost, high-resolution endoscopic microscope for obtaining fluorescent images of the cellular morphology of the epithelium of regions of the esophagus with Barrett's metaplasia. This noninvasive point imaging system offers a method for obtaining real-time histologic information during endoscopy.

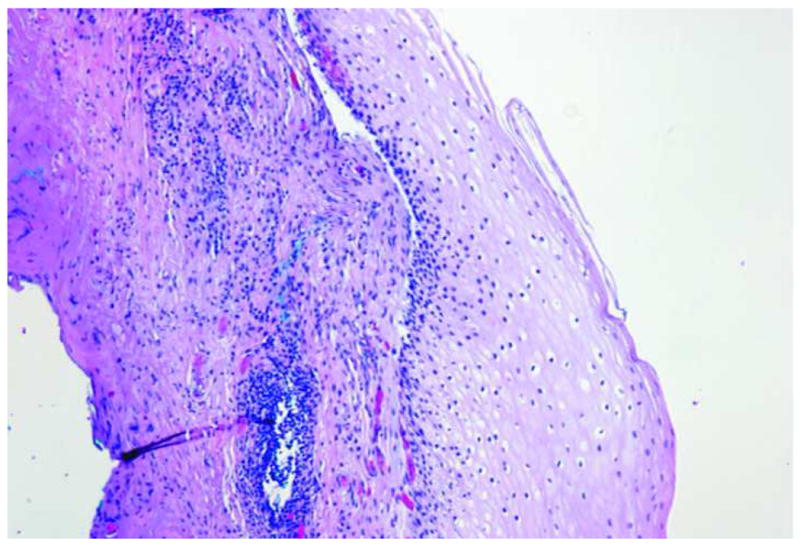
Objective: The objective of this study was to compare images taken with the fiberoptic endoscopic microscope with standard histopathologic examination.

Design: Feasibility study.

Setting: The University of Texas M.D. Anderson Cancer Center Department of Gastroenterology. PATIENTS, INTERVENTIONS, AND MAIN OUTCOME MEASUREMENTS: The tissue samples studied in this report were obtained by endoscopic resection from patients with previous diagnoses of either high-grade dysplasia or esophageal adenocarcinoma.

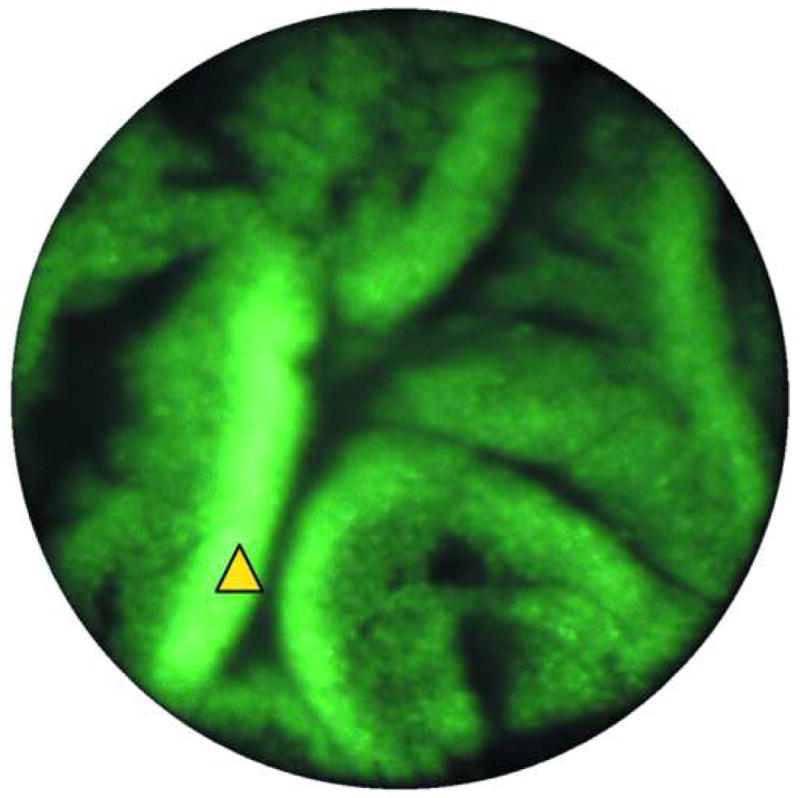
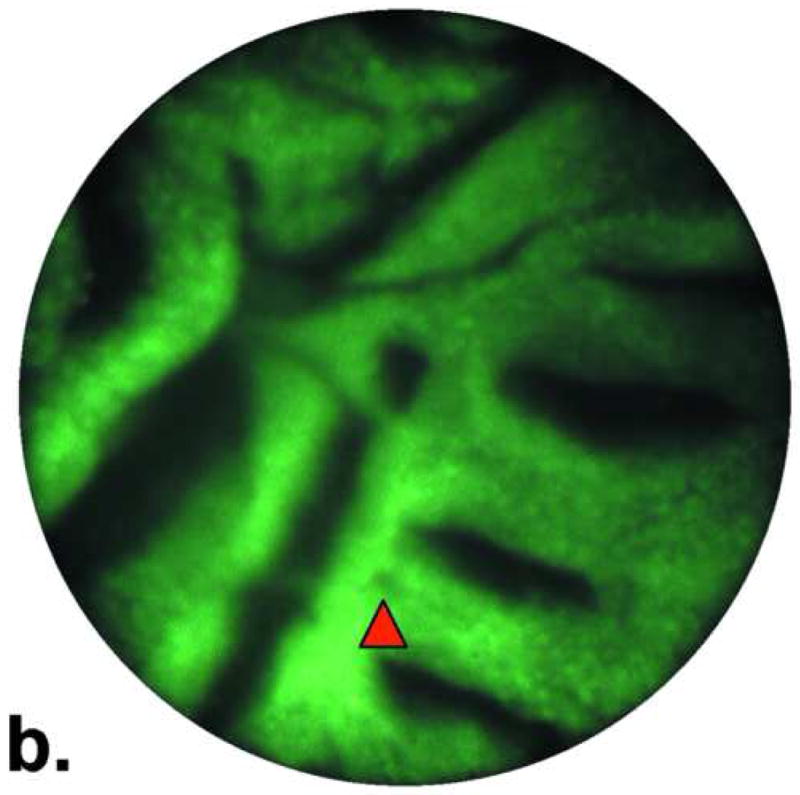
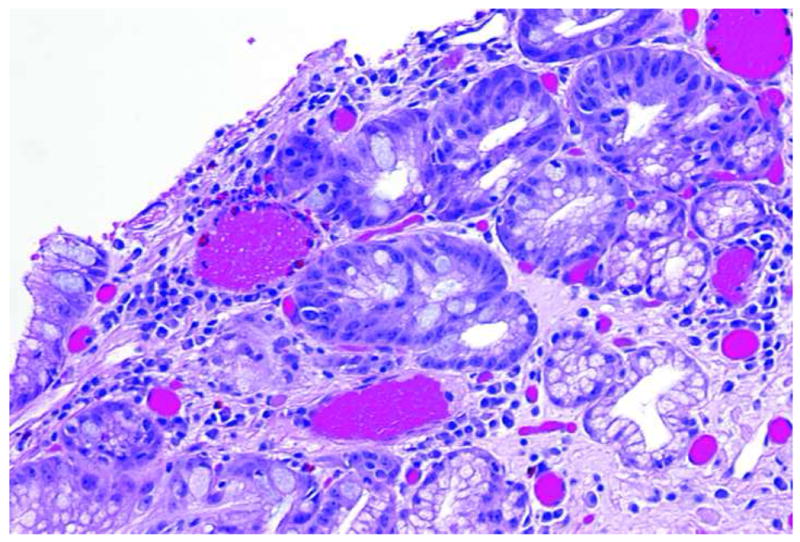
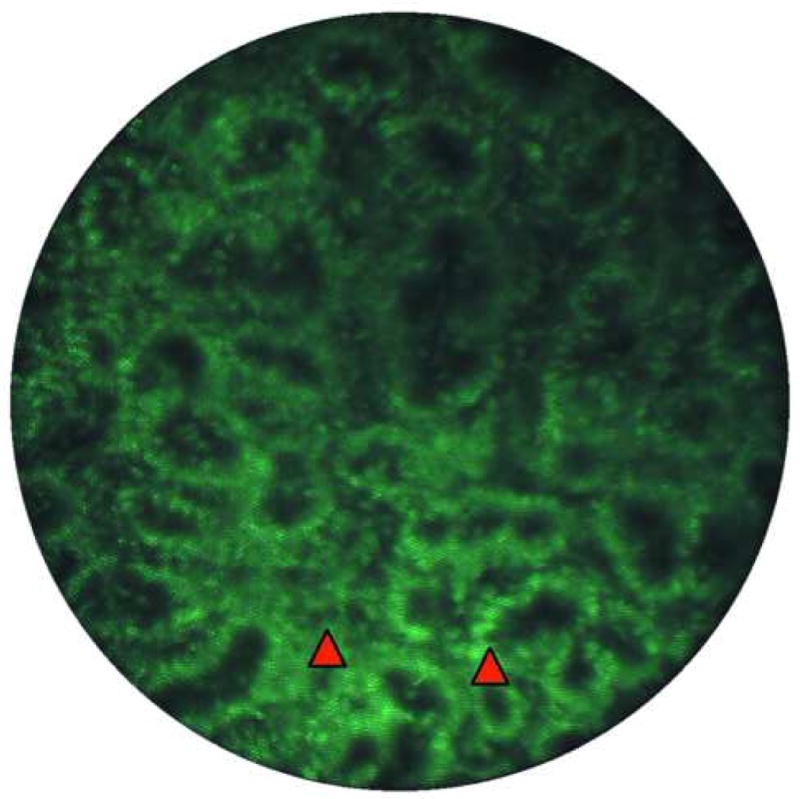
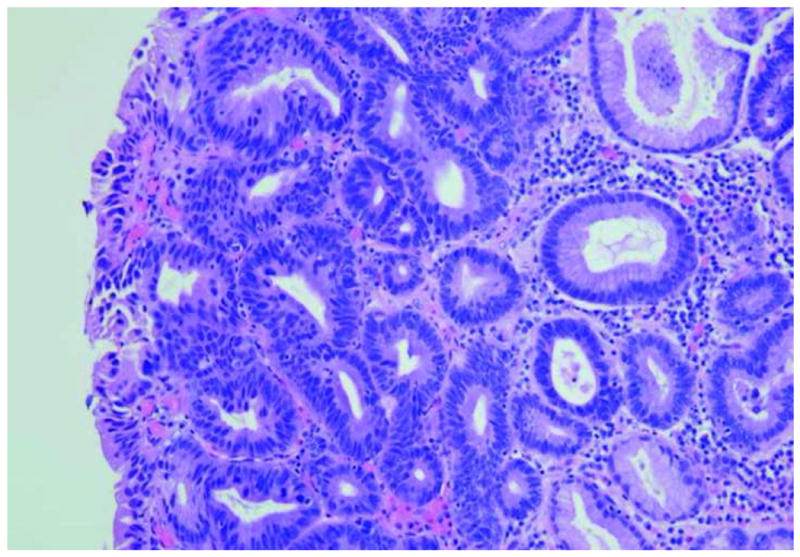
Results: Three distinct tissue types were observed ex vivo with the endoscopic microscope: normal squamous mucosa, Barrett's metaplasia, and high-grade dysplasia. Squamous tissue was identified by bright nuclei surrounded by dark cytoplasm in an ordered pattern. Barrett's metaplasia could be identified by large glandular structures with intact nuclear polarity. High-grade dysplasia was visualized as plentiful, irregular glandular structures and loss of nuclear polarity. Standard histopathologic examination of study samples confirmed the results obtained by the endoscopic microscope.

Limitations: The endoscopic microscope probe had to be placed into direct contact with tissue.

Conclusions: It was feasible to obtain high-resolution histopathologic information using the endoscopic microscope device. Future improvement and integration with widefield endoscopic techniques will aid in improving the sensitivity of detection of dysplasia and early cancer development in the esophagus.


Figures

Figure 1
Figure 1
Endoscopic Microscope. A. Image of fiber bundle extending through the biopsy port of a standard white-light endoscope. B. Image of fiber bundle probe in vivo. C. Image of table-top endoscopic microscope; fluorescence microscope unit is on the left, data-acquisition PC is on the right. D. Schematic overview of the system.
Figure 1
Figure 1
Endoscopic Microscope. A. Image of fiber bundle extending through the biopsy port of a standard white-light endoscope. B. Image of fiber bundle probe in vivo. C. Image of table-top endoscopic microscope; fluorescence microscope unit is on the left, data-acquisition PC is on the right. D. Schematic overview of the system.
Figure 2
Figure 2
Images of normal squamous tissue. A. Endoscopic microscope image of normal squamous tissue stained with 0.05% acriflavine. B. Benchtop confocal (Zeiss LSM 510 Meta) image of same tissue. C. Pentax endoscopic confocal image of same tissue. A-C show flat arrangement of squamous epithelium with round regularly spaced nuclei. The round clear spaces surrounded by the epithelium represent the papillae (red arrowhead). The acriflavine in image A highlights the nuclei. D. Histopathology of same specimen. Scale bar is 100 microns.
Figure 2
Figure 2
Images of normal squamous tissue. A. Endoscopic microscope image of normal squamous tissue stained with 0.05% acriflavine. B. Benchtop confocal (Zeiss LSM 510 Meta) image of same tissue. C. Pentax endoscopic confocal image of same tissue. A-C show flat arrangement of squamous epithelium with round regularly spaced nuclei. The round clear spaces surrounded by the epithelium represent the papillae (red arrowhead). The acriflavine in image A highlights the nuclei. D. Histopathology of same specimen. Scale bar is 100 microns.
Figure 3
Figure 3
Images of Barrett's metaplasia. A. and B. Endoscopic microscope of Barrett's metaplasia stained with 0.05% acriflavine. Image A shows broad villous architecture. The bright band at the base of each villous-like structure indicates the high uptake of acriflavine by the nuclei (yellow arrowhead). Image B shows larger torus-like structures with intervening stroma. Occasional goblet cells are highlighted by a marker (red arrowhead). C. Histopathology of same sample. Scale bars are 100 microns; all images at the same scale.
Figure 3
Figure 3
Images of Barrett's metaplasia. A. and B. Endoscopic microscope of Barrett's metaplasia stained with 0.05% acriflavine. Image A shows broad villous architecture. The bright band at the base of each villous-like structure indicates the high uptake of acriflavine by the nuclei (yellow arrowhead). Image B shows larger torus-like structures with intervening stroma. Occasional goblet cells are highlighted by a marker (red arrowhead). C. Histopathology of same sample. Scale bars are 100 microns; all images at the same scale.
Figure 4
Figure 4
Image of high-grade dysplasia. A. Endoscopic microscope image of high grade dysplasia stained with 0.05% acriflavine. Confluent and haphazard glandular proliferation with back–to-back arrangements and minimal to absent stroma. Foci of high nuclear intensity and high nuclear–to-cytoplasmic ratio are highlighted by markers (red arrowheads). B. Histopathology of same specimen. Scale bar is 100 microns; all images are at the same scale.
Figure 4
Figure 4
Image of high-grade dysplasia. A. Endoscopic microscope image of high grade dysplasia stained with 0.05% acriflavine. Confluent and haphazard glandular proliferation with back–to-back arrangements and minimal to absent stroma. Foci of high nuclear intensity and high nuclear–to-cytoplasmic ratio are highlighted by markers (red arrowheads). B. Histopathology of same specimen. Scale bar is 100 microns; all images are at the same scale.

References

    1. Williamson WA, Ellis FH, Jr, Gibb SP, Shahian DM, Aretz HT, Heatley GJ, Watkins E., Jr Barrett's esophagus. Prevalence and incidence of adenocarcinoma. Arch Intern Med. 1991;151:2212–6. - PubMed
    1. DeVault KR. Epidemiology and significance of Barrett's esophagus. Dig Dis. 2000;18:195–202. - PubMed
    1. Cameron AJ. Epidemiology of Barrett's esophagus and adenocarcinoma. Dis Esophagus. 2002;15:106–8. - PubMed
    1. Thomson BNJ, Cade RJ. Oesophagectomy for early adenocarcinoma and dysplasia arising in Barrett's oesophagus. Anz Journal of Surgery. 2003;73:121–124. - PubMed
    1. Dellon ES, Shaheen NJ. Does screening for Barrett's esophagus and adenocarcinorna of the esophagus prolong survival? Journal of Clinical Oncology. 2005;23:4478–4482. - PubMed

Publication types

MeSH terms