

Review
doi: 10.1016/j.mric.2008.07.001.
Assessment of renal function with dynamic contrast-enhanced MR imaging
Affiliations
- PMID: 18926425
- PMCID: PMC2590938
- DOI: 10.1016/j.mric.2008.07.001
Item in Clipboard
Review
Assessment of renal function with dynamic contrast-enhanced MR imaging
Magn Reson Imaging Clin N Am.
2008 Nov.
Abstract
MR imaging is a promising noninvasive modality that can provide a comprehensive picture of renal anatomy and function in a single examination. The advantages of MR imaging are its high contrast and temporal resolution and lack of exposure to ionizing radiation. In the past few years, considerable progress has been made in development of methods of renal functional MR imaging and their applications in various diseases. This article reviews the key factors for acquisition and analysis of dynamic contrast-enhanced renal MR imaging (MR renography) and the most significant developments in this field over the past few years.
Figures
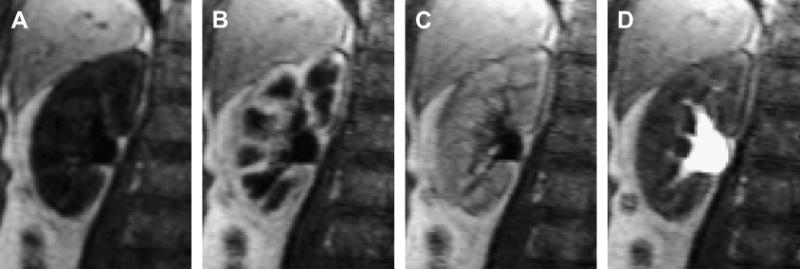
Representative MR renography images of the right kidney of a 65-year-old female patient with normal kidney function showing progressive enhancement of kidney tissue (injected dose 4 mL of Gd-DTPA at 2 mL/s; 3D FLASH, TR/TE/FA=2.84/1.05/12°, voxel volume 1.7×1.7×2.5 mm3): a) unenhanced, b) maximum cortical enhancement, c) maximum medullary enhancement, d) collecting system enhancement.
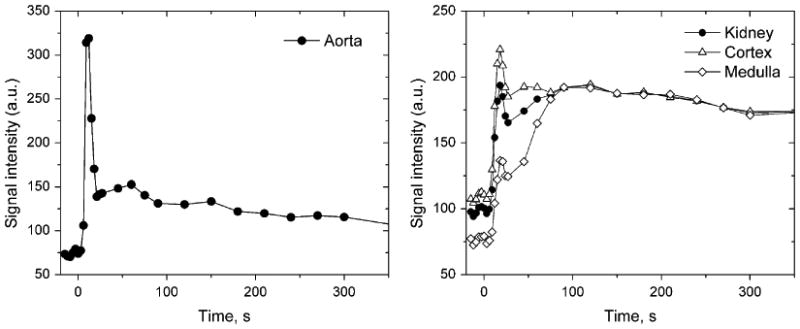
Signal intensity measured in abdominal aorta (a) and cortex and medulla (b) for the same patient as in Figure 1. Rapid first-pass signal changes in aorta and kidneys are sampled every 3 s during the first 30 s. The cortical and medullary signal intensity curves show sharper peaks due to renal vasculature followed by broader peaks due to the contrast in the renal tubules.
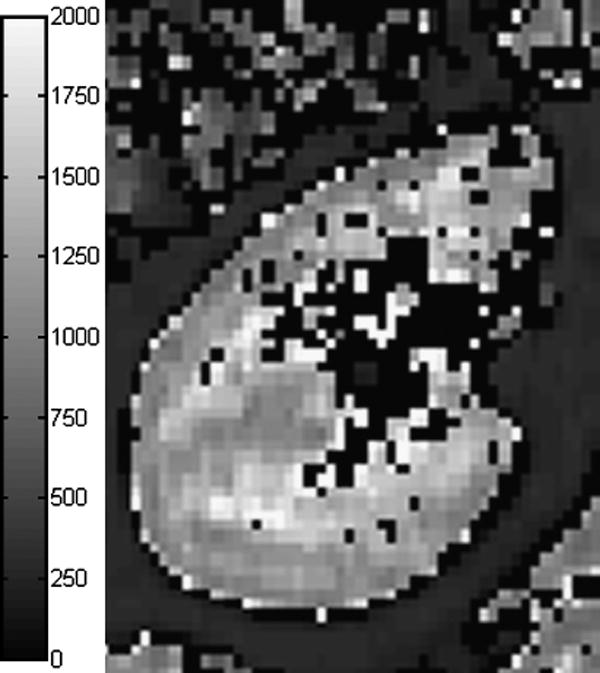
Kidney T1-map measured with single breath-hold, segmented, inversion-recovery prepared TrueFISP with flip angle of 10° (29). Cortical T1 is about 1050 ms and medullary T1 is about 1400-1500 ms. T1 was set to zero in voxels where fitting failed or yielded T1 above 2000 ms.
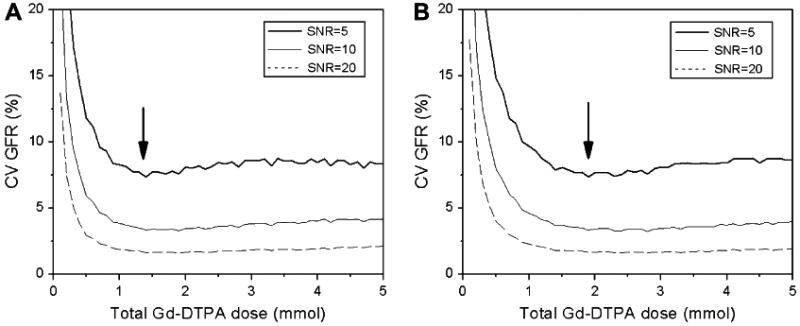
The effect of gadolinium dose on precision of GFR measurement with MRR. Coefficient of variation (CV) of GFR was estimated by Monte Carlo simulations for normal (a) and diseased (b) kidney versus the total injected dose. Arrows indicate the minimum of CV.
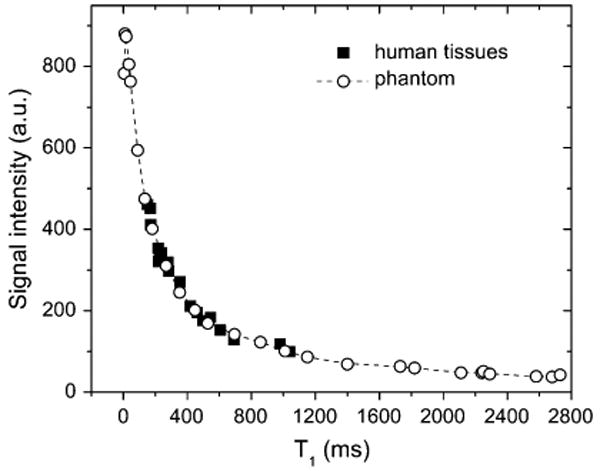
Signal intensity versus T1 relationship derived from imaging a gadolinium-doped water phantom and in vivo human tissues (after Ref. (29)). The signal versus T1 dependence in the phantom and human tissues appears to be similar.
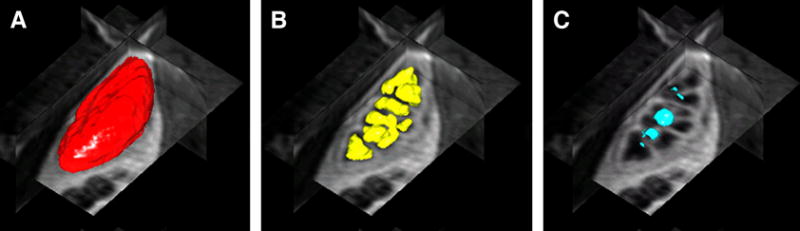
3D renderings and orthogonal views of renal tissue segmented using level sets algorithm of Song et al (47) (a) whole kidney (b) medulla (c) renal pelvis.
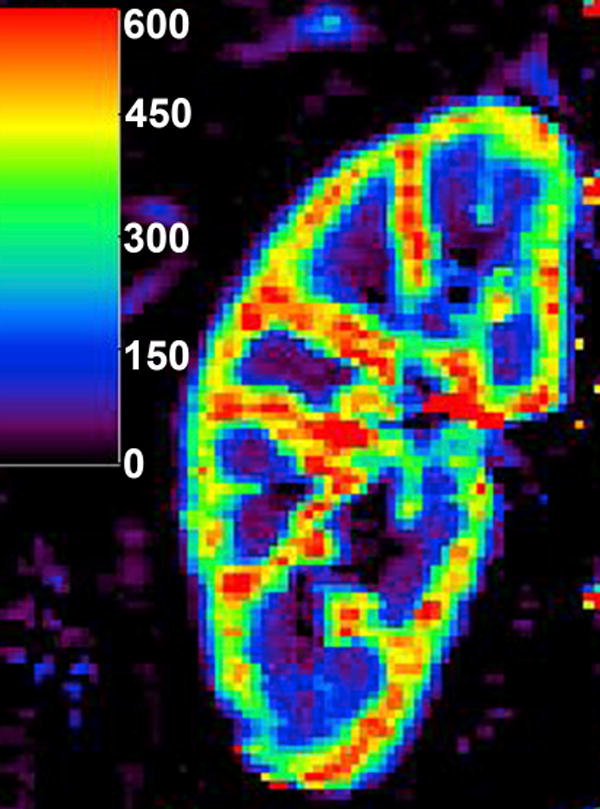
Perfusion map calculated with two-compartment model of Annet et al (20) in a normally functioning kidney. The units of the color bar are mL/min/100mL. The regions of extremely high flow (red) are likely to reflect the renal vessels.
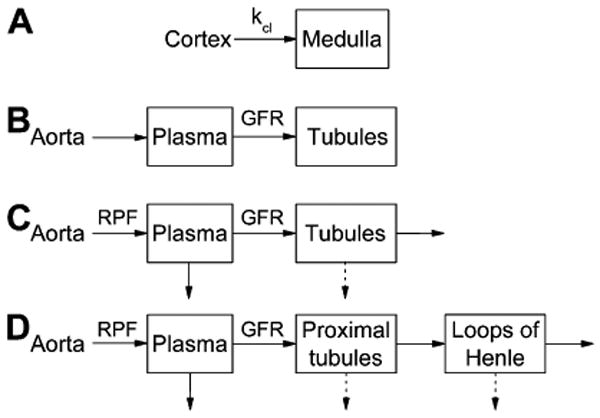
Tracer kinetic renal models for GFR calculation: a) Baumann-Rudin model; b) Patlak-Rutland model; c) two-compartment models of Annet et al (20) and Buckley et al (17); d) three-compartment models of Lee et al (5) and Zhang et al (63). In (a), kcl is the clearance coefficient related to GFR. Ao is the aortic concentration; Cx and Med are cortical and medullary concentrations. A, P, and L are the arterial, proximal tubules and loops of Henle compartments, respectively. Solid arrows indicate the flow of contrast, and dashed arrows indicate the flow of contrast-free fluid.
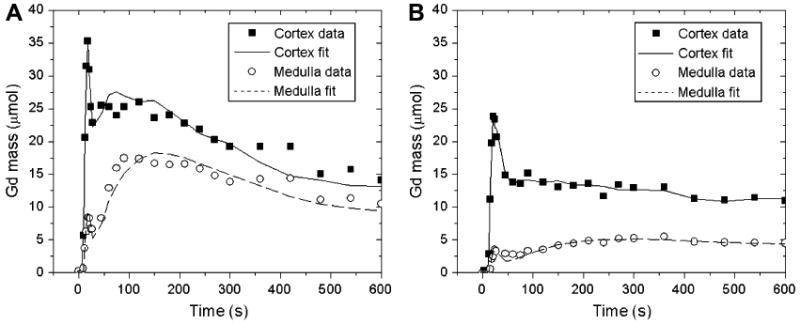
Gadolinium residue (mass) in the cortex and medulla of a functioning kidney (a) and a diseased kidney (b) fitted by the three-compartment model of Zhang et al (63). Cortical and medullary residues are considerably lower in diseased kidney (b) than in the functioning kidney (a), but Zhang's model provides good curve fits in both cases.
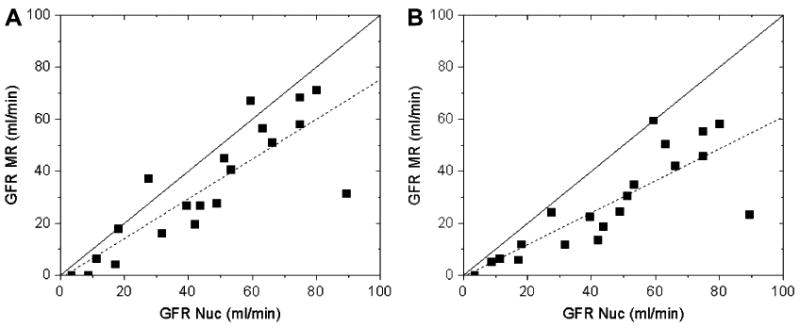
Single-kidney GFRs obtained from the same data using models of Lee et al (5) (a) and Zhang et al (63) (b) versus the GFR values from the same-day nuclear medicine measurements. Both models underestimate GFR, especially Zhang's model, but provide comparable correlations with radionuclide measurements. The linear regressions (dashed lines) are y = 0.76x -1.14 (r = 0.84) (a) and y = 0.61x − 0.32 (r = 0.82) (b). Solid lines are the identity lines.
References
-
- Choyke PL, Austin HA, Frank JA, Girton ME, Diggs RL, Dwyer AJ, et al. Hydrated clearance of gadolinium-DTPA as a measurement of glomerular filtration rate. Kidney Int. 1992;41:1595–98. - PubMed
-
- Ros PR, Gauger J, Stoupis C, Burton SS, Mao J, Wilcox C, et al. Diagnosis of renal artery stenosis: feasibility of combining MR angiography, MR renography, and gadopentetate-based measurements of glomerular filtration rate. AJR Am J Roentgenol. 1995;165(6):1447–51. - PubMed
-
- Szolar DH, Preidler K, Ebner F, Kammerhuber F, Horn S, Ratschek M, et al. Functional magnetic resonance imaging of human renal allografts during the post-transplant period: preliminary observations. Magn Reson Imaging. 1997;15(7):727–35. - PubMed
-
- Wolf GL, Hoop B, Cannillo JA, Rogowska JA, Halpern EF. Measurement of renal transit of gadopentetate dimeglumine with echo-planar MR imaging. J Magn Reson Imaging. 1994;4(3):365–72. - PubMed
-
- Lee VS, Rusinek H, Bokacheva L, Huang AJ, Oesingmann N, Chen Q, et al. Renal function measurements from MR renography and a simplified multicompartmental model. Am J Physiol Renal Physiol. 2007;292:F1548–59. - PubMed
Publication types
MeSH terms
Substances
Grants and funding
LinkOut - more resources
Full Text Sources
Other Literature Sources
Medical
Miscellaneous
