. 2008 Dec 19;384(3):615-30.
doi: 10.1016/j.jmb.2008.09.065. Epub 2008 Oct 7.

Myosin binding protein C positioned to play a key role in regulation of muscle contraction: structure and interactions of domain C1

Affiliations

Myosin binding protein C positioned to play a key role in regulation of muscle contraction: structure and interactions of domain C1

Abdessamad Ababou et al. J Mol Biol. .

Abstract

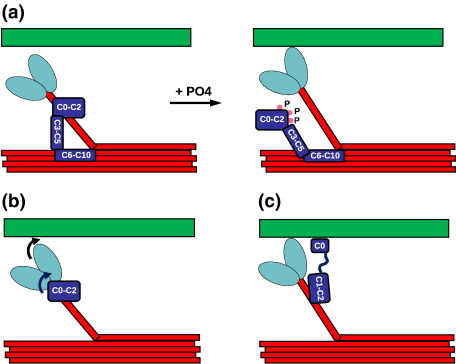
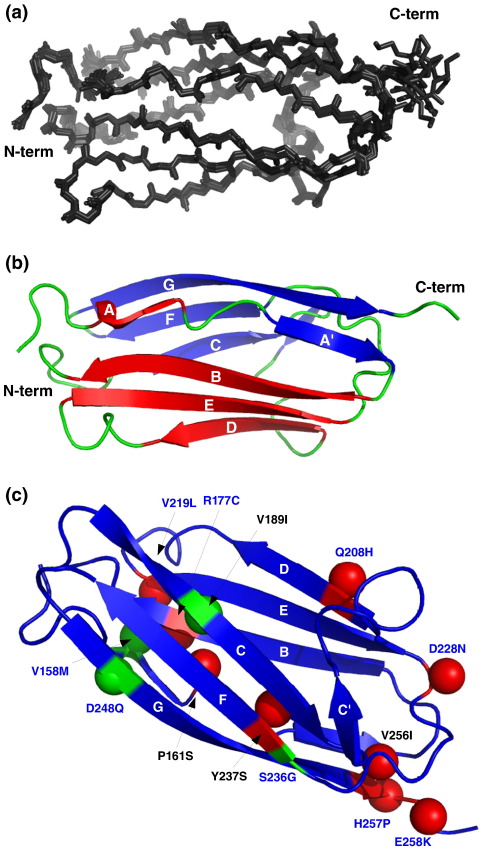
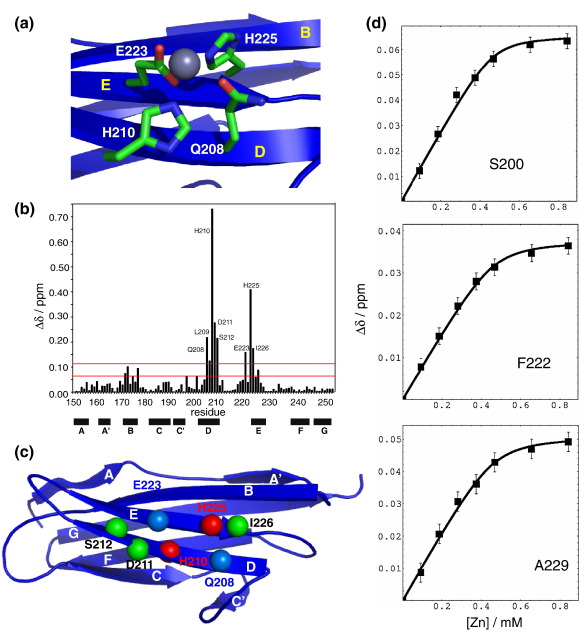
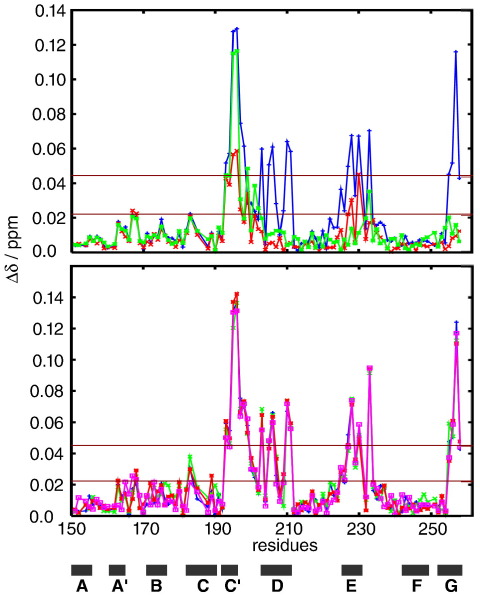
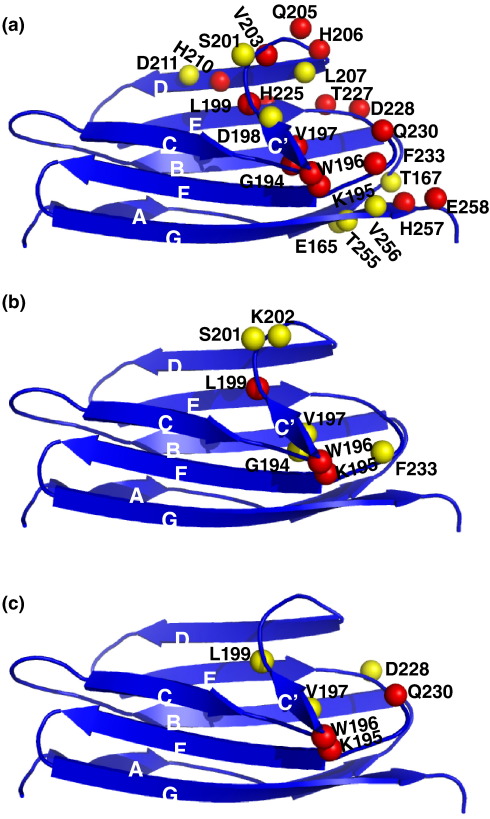
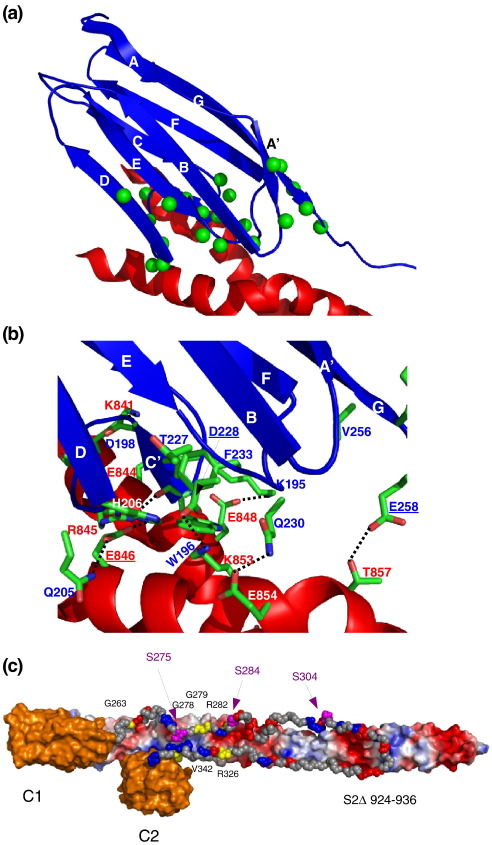
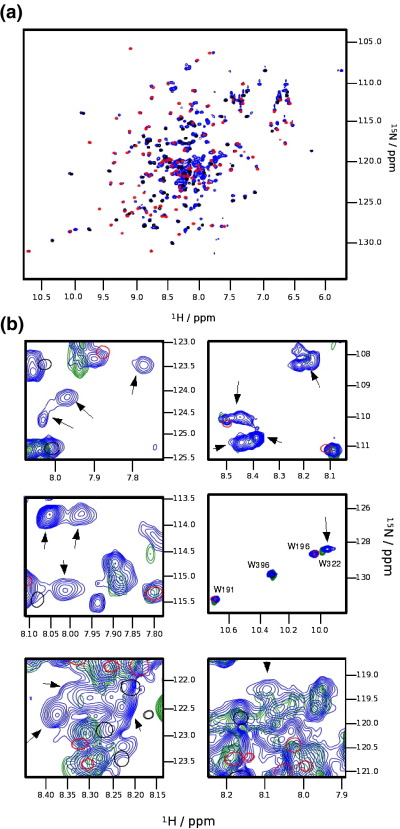
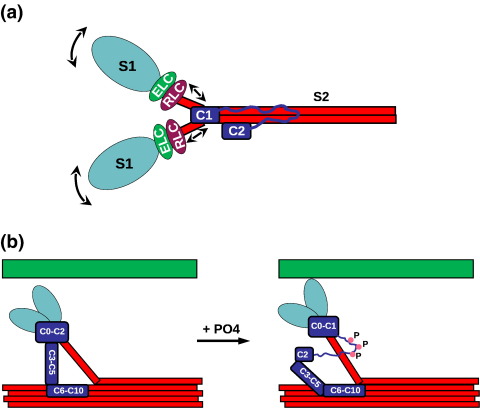
Myosin binding protein C (MyBP-C) is a thick filament protein involved in the regulation of muscle contraction. Mutations in the gene for MyBP-C are the second most frequent cause of hypertrophic cardiomyopathy. MyBP-C binds to myosin with two binding sites, one at its C-terminus and another at its N-terminus. The N-terminal binding site, consisting of immunoglobulin domains C1 and C2 connected by a flexible linker, interacts with the S2 segment of myosin in a phosphorylation-regulated manner. It is assumed that the function of MyBP-C is to act as a tether that fixes the S1 heads in a resting position and that phosphorylation releases the S1 heads into an active state. Here, we report the structure and binding properties of domain C1. Using a combination of site-directed mutagenesis and NMR interaction experiments, we identified the binding site of domain C1 in the immediate vicinity of the S1-S2 hinge, very close to the light chains. In addition, we identified a zinc binding site on domain C1 in close proximity to the S2 binding site. Its zinc binding affinity (K(d) of approximately 10-20 microM) might not be sufficient for a physiological effect. However, the familial hypertrophic cardiomyopathy-related mutation of one of the zinc ligands, glutamine 210 to histidine, will significantly increase the binding affinity, suggesting that this mutation may affect S2 binding. The close proximity of the C1 binding site to the hinge, the light chains and the S1 heads also provides an explanation for recent observations that (a) shorter fragments of MyBP-C unable to act as a tether still have an effect on the actomyosin ATPase and (b) as to why the myosin head positions in phosphorylated wild-type mice and MyBP-C knockout mice are so different: Domain C1 bound to the S1-S2 hinge is able to manipulate S1 head positions, thus influencing force generation without tether. The potentially extensive extra interactions of C1 are expected to keep it in place, while phosphorylation dislodges the C1-C2 linker and domain C2. As a result, the myosin heads would always be attached to a tether that has phosphorylation-dependent length regulation.


Figures

Fig. 1
Fig. 1
Cartoon depicting current understanding of MyBP-C function. (a) Illustration of the expected effect of phosphorylation of the N-terminal myosin binding site that dislodges MyBP-C, releasing the S2 coiled coil and subsequently promoting cross-bridge formation and muscle contraction. (b) A possible interpretation of the observation that MyBP-C constructs too short to act as a tether can influence muscle contraction. In this interpretation, the N-terminus directly affects the orientation of the myosin head group, indicated by the arrows. (c) Alternative interpretation where the effect of an N-terminal fragment of MyBP-C is caused by an interaction with the thin filament. The coiled-coil part of myosin is shown in red; S1, in light blue; MyBP-C, in dark blue; and F-actin, in green. For simplicity, several MyBP-C domains are grouped in a single box. Phosphorylated residues are indicated by pink dots.
Fig. 2
Fig. 2
Structure of domain C1 of human cardiac MyBP-C. (a) Family of the best 29 structures resulting from the final round of structure calculation. (b) Cartoon view of the best structure of C1 from the family of structures in (a) in the same orientation as in (a). (c) FHC-linked point mutations found in C1 mapped on the structure of C1. Residues found mutated with a clear disease indication are shown in red, and those shown to be polymorphisms are shown in green. β-Carbons are shown as a Van der Waals sphere for all to make the side-chain orientation more evident. Labels for solvent-exposed residues are shown in blue, and those for non-exposed residues are shown in black. The β-strands are labelled in white. Strands A and A′ are hidden.
Fig. 3
Fig. 3
Zinc binding of C1. (a) Detailed view of the zinc binding site in the structure of C1. Only side chains of Gln208, His210, Glu223 and His225 are shown. A zinc atom has been modelled in the binding site. After energy minimisation, the zinc-ligand distances are 2.27 Å for His210(Ne2), 2.26 Å for His225(Ne2), 1.60 Å for Glu223(Oe1), 1.81 Å for Glu223 (Oe2) and 2.22 Å for Gln208(Oe1). (b) Plot of chemical shift perturbation against the protein sequence. The first red line represents the 〈Δδ〉tot level, and the second red line is 〈Δδ〉tot + 1∗σ. Residues with chemical shift perturbations above 〈Δδ〉tot + 1∗σ are explicitly labelled. (b) Titration curves for residues in fast exchange for estimating binding affinity and stoichiometry. (c) Mapping of chemical shift perturbations on the three-dimensional structure of C1. Residues with chemical shift perturbations above 〈Δδ〉tot + 1∗σ are shown as spheres. The residues expected to coordinate the zinc are shown in red (histidines) and blue (glutamate/glutamine), and those with significant perturbations not expected to be directly involved are shown in green. (d) Titration curves for residues in fast exchange for estimating binding affinity and stoichiometry.
Fig. 4
Fig. 4
Expression trials of C1 mutants D228N and Y236S. Pilot expression was performed in 5-mL cultures in 20-mL tubes using BL21∗ cells. Cells were grown at 37 °C until reaching induction levels of cell density, after which the temperature was dropped to 15 °C and protein expression was induced overnight. Cells were harvested by centrifugation and opened by sonication. Samples for gel electrophoresis were taken of the soluble fraction after centrifugation of the cell extracts. M, molecular mass marker (Mark12, Invitrogen; molecular masses are given in kilodaltons); 1, C1 D228N; 2, C1 Y237S. Expected position of C1 is marked by an arrow.
Fig. 5
Fig. 5
Chemical shift perturbations in titrations of 15N-labelled C1 with unlabelled S2Δ. Shown are combined 15N and 1HN chemical shift perturbations against the sequence of C1. Top: C1 WT + S2Δ WT (blue), C1 WT + S2Δ E846K (red) and C1 D228N + S2Δ WT (green). Bottom: C1 WT + S2Δ WT (blue), C1 WT + S2Δ E924K (green), C1 WT + S2Δ E936K (red) and C1 WT + S2Δ E894G (pink). The 〈Δδ〉tot and 〈Δδ〉tot + 1∗σ levels (0.021 and 0.042 ppm, respectively) for C1 WT + S2Δ WT are shown as dark red horizontal lines. The position of β-strands is indicated by black bars.
Fig. 6
Fig. 6
The S2Δ binding site on C1 mapped by chemical shift perturbations on the three-dimensional structure. (a) Binding of C1 to S2Δ. (b) Binding of C1 D228N to S2Δ. (c) Binding of C1 to S2Δ E846K. All residues with chemical shift perturbations above 〈Δδ〉tot are labelled and have their N atoms displayed as spheres. Residues with Δδ values between 〈Δδ〉tot and 〈Δδ〉tot + 1∗σ are shown in yellow, and those above 〈Δδ〉tot + 1∗σ are shown in red. The β-strands are labelled in white.
Fig. 7
Fig. 7
Model of the complex of C1 and S2Δ. (a) Overview of the position of C1 (blue) on S2Δ (red). Amino acids in C1 with chemical shift perturbations larger than 〈Δδtot are marked by green spheres on their N positions. (b) Detailed view of the interactions of C1 and S2Δ in the model. C1 is shown in blue, and S2Δ is shown in red. Important side chains in the interaction are coloured by atom type (carbon, green; oxygen, red; nitrogen, blue), and labels are coloured by protein. (c) Depiction of the overall assembly of C1 and C2 and the linker on S2Δ. Domains C1 and C2 of MyBP-C are shown in orange, and the linker between them is shown in gray. The three phosphorylation sites in the linker are shown in purple, residues mutated in FHC are shown in yellow with labels and charged residues are coloured according to their charge. S2Δ is shown with solvent-accessible surface coloured by a simple electrostatic potential with the N-terminus on the left (hidden by C1) and the C-terminus on the right. The position of the C-terminal cluster of FHC-related point mutations in S2Δ is indicated by the residue numbers (924–936).
Fig. 8
Fig. 8
NMR of 15N-labelled construct C1C2, corresponding to residues 151–451 of human cardiac MyBP-C. (a) Heteronuclear single-quantum coherence spectrum of C1C2 (blue) superimposed with the spectra of C1 (black) and C2 (red). (b) Sections of a heteronuclear 1H–15N NOE experiment (green) of C1C2 superimposed on its reference experiment (blue) together with the spectra of C1 (black) and C2 (red). Peaks of the linker showing very weak NOEs around zero are indicated by arrows.
Fig. 9
Fig. 9
Summary of the results. (a) Potential effects of C1 binding close to the hinge and the light chains. Interactions of C1 could either bring the heads closer or drive them farther apart as indicated by the arrows. These effects could occur symmetrically or asymmetrically. (b) As a consequence of C1 binding to the S1–S2 hinge domain, C1 and the region further N-terminal might remain bound even when MyBP-C gets phosphorylated. C2 binds weaker than C1 and could be dislodged with the C1–C2 linker, thus only lengthening the leash without ever completely unleashing the S1 heads. The coiled-coil part of myosin is shown in red; S1, in light blue; MyBP-C, in dark blue; and F-actin, in green. For simplicity, several MyBP-C domains are summarised in a single box. Phosphorylated residues are indicated by pink dots.

References

    1. Kobayashi T., Solaro R.J. Calcium, thin filaments, and the integrative biology of cardiac contractility. Annu. Rev. Physiol. 2005;67:39–67. - PubMed
    1. Winegrad S. Myosin-binding protein C (MyBP-C) in cardiac muscle and contractility. Adv. Exp. Med. Biol. 2003;538:31–40. Discussion 40-1. - PubMed
    1. Oakley C.E., Hambly B.D., Curmi P.M.G., Brown L.J. Myosin binding protein C: structural abnormalities in familial hypertrophic cardiomyopathy. Cell Res. 2004;14:95–110. - PubMed
    1. Winegrad S. Myosin binding protein C, a potential regulator of cardiac contractility. Circulation. 2000;86:6–7. - PubMed
    1. Lange S., Ehler E., Gautel M. From A to Z and back? Multicompartment proteins in the sarcomere. Trends Cell Biol. 2006;16:11–18. - PubMed

Publication types

Associated data