. 2008 Dec 12;283(50):35033-41.
doi: 10.1074/jbc.M806353200. Epub 2008 Oct 16.

Monitoring light-induced structural changes of Channelrhodopsin-2 by UV-visible and Fourier transform infrared spectroscopy

Affiliations

Monitoring light-induced structural changes of Channelrhodopsin-2 by UV-visible and Fourier transform infrared spectroscopy

Eglof Ritter et al. J Biol Chem. .

Abstract

Channelrhodopsin-2 (ChR2) is a microbial type rhodopsin and a light-gated cation channel that controls phototaxis in Chlamydomonas. We expressed ChR2 in COS-cells, purified it, and subsequently investigated this unusual photoreceptor by flash photolysis and UV-visible and Fourier transform infrared difference spectroscopy. Several transient photoproducts of the wild type ChR2 were identified, and their kinetics and molecular properties were compared with those of the ChR2 mutant E90Q. Based on the spectroscopic data we developed a model of the photocycle comprising six distinguishable intermediates. This photocycle shows similarities to the photocycle of the ChR2-related Channelrhodopsin of Volvox but also displays significant differences. We show that molecular changes include retinal isomerization, changes in hydrogen bonding of carboxylic acids, and large alterations of the protein backbone structure. These alterations are stronger than those observed in the photocycle of other microbial rhodopsins like bacteriorhodopsin and are related to those occurring in animal rhodopsins. UV-visible and Fourier transform infrared difference spectroscopy revealed two late intermediates with different time constants of tau = 6 and 40 s that exist during the recovery of the dark state. The carboxylic side chain of Glu(90) is involved in the slow transition. The molecular changes during the ChR2 photocycle are discussed with respect to other members of the rhodopsin family.


Figures

FIGURE 1.
FIGURE 1.
UV-visible spectroscopy of the photostationary state and the late conversions of purified ChR2. A, absorbance spectra of purified WT ChR2 in dodecyl maltoside solution of the dark-adapted state at pH 6 (gray line) and after 10 s of illumination with blue light at pH 6 (456 nm; green line), pH 8 (blue line), and at pH 4.5 (red line), normalized to the band at 280 nm. Inset, difference spectra (light minus dark, pH 6) of WT and the E90Q mutant. B, recovery of dark-adapted ChR2 WT (blue line) and E90Q mutant (green line). Absorbance changes at 456 nm after illumination are shown as a function of time. The time constants and the respective standard deviations for the recovery process at the different pH values are given in the table. All of the fits showed a R2 > 0.994.
FIGURE 2.
FIGURE 2.
Time-resolved UV-visible spectroscopy of purified ChR2. A, three-dimensional reconstruction of time-resolved absorbance changes of ChR2 WT at pH 6 in the time-range of 0.8-15 μs after laser flash excitation, based on the most significant components as obtained by singular value decomposition. B, reconstructed spectra of WT at pH 6 as in A, in the time range of 0.4-8 ms. C, reconstructed spectra of the WT as in A, in the time range of 1.8-30 ms. D, reconstructed spectra of the E90Q mutant as in A. E, reconstructed spectra of the E90Q mutant as in B. F, reconstructed spectra of the E90Q mutant as in C. G, absorbance spectra (b-spectra) of the pure components, resulting from singular value decomposition and global analysis of the data from WT. The early intermediate P500, which is formed immediately after the flash (blue circles) is seen as the difference maximum at 520 nm, whereas the two later intermediates P390 (τ = 25 μs, green circles) and P520 (τ = 1.5 ms, red circles) are seen as difference maxima at 380 and 530 nm. H, absorbance spectra (b-spectra) of the pure components calculated as in G, for the E90Q mutant. I, UV-visible flash photolysis. Absorbance changes recorded at 380 nm, pH 6, as a function of time, were indicative for the kinetics of the deprotonated species.
FIGURE 3.
FIGURE 3.
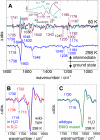
FTIR difference spectroscopy of channelrhodopsin intermediates. A, maroon, photoproduct minus dark state FTIR difference spectrum recorded at 80 K. The sample was illuminated for 30 s with 475 nm light. The bands in the chromophore fingerprint region from 1350 to 1150 cm-1 and in the C=C stretching region around 1550 cm-1 are indicative for chromophore isomerization. Structural alterations are reflected by difference bands in the amide I region, most prominent at 1665 cm-1. A further unique feature of the spectrum is the bilobe at 1735/1741 cm-1 in the range of the C=O stretching vibration of protonated carboxylic acids. Inset, maroon, UV-visible difference spectrum (photoproduct minus dark state) of the same sample at 80 K. Negative bands at 413, 442, and 475 nm and a positive band at 504 nm indicate depletion of the dark state and formation of a photoproduct. The further red-shifted absorption maximum shows that the photoproduct bears a protonated Schiff base. Cyan lines, UV-visible and FTIR difference spectra of illumination of the 80 K intermediate with 520-nm light. Blue, photostationary minus dark state FTIR difference recorded at 298 K. The sample was illuminated with 475-nm light. Difference bands in the chromophore fingerprint region occur with decreased intensities, whereas the strong difference band in the amide I region at 1663 cm-1 shows a comparable intensity as in the spectrum obtained at 80 K. B, blue, photostationary state minus dark state FTIR difference at 298 K in the spectral region between 1600 and 1780 cm-1. Red, the spectrum, recorded under the same conditions but in D2O. Bands at 1730 and 1718 cm-1 undergo deuteration-induced downshifts. C, blue, photostationary minus dark state FTIR difference spectrum at 298 K (same spectrum as in B, blue). C, dark green, photostationary state minus dark state difference spectrum of the E90Q mutant at 298 K. The 1730 (+)/1718 (-)cm-1 difference band is not observed in this spectrum.
FIGURE 4.
FIGURE 4.
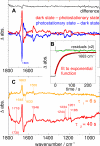
Completion of the photocycle and late intermediates. A, Blue, photostationary minus initial (dark) state difference spectrum, obtained by 475 nm illumination at 298 K. Red, dark state minus photostationary state difference spectrum. The spectrum of the dark state was now taken 15 min after the light was switched off. Black, difference between the two spectra. This figure shows that the dark state is recovered within 15 min after light excitation. B, black, time course of the negative band at 1663 cm-1, observed after the light was switched off. The picture illustrates the formation of the dark state starting from the photostationary state. The data cannot exactly be described by an one-phase exponential function (red), as indicated by the residuals (upper black line). For further characterization of the data, singular value decomposition in combination with a rotation procedure and global fitting was performed. We could identify a slow and a fast component, with time constants of 40 s (red) and 6 s (orange), respectively. A biexponential function comprising these two components fits the data as shown by the residuals (upper light green line). C, FTIR difference spectra (b-spectra) of the pure components obtained by singular value decomposition and global analysis of the transition from the photostationary state to the dark state (orange; fast component τ = 6 s, red; slow component τ = 40 s).
FIGURE 5.
FIGURE 5.
Photocycle model of ChR2. Six-state photocycle model including the intermediates as identified by UV-visible spectroscopy and infrared difference spectroscopy is shown. The D470 dark state with a protonated Schiff base is converted by a light-induced retinal isomerization into the early intermediate P500. Thermal relaxation leads via transient Schiff base deprotonation (P390) and structural alterations of the protein to the conducting state P520, which most probably is identical to the intermediate cryotrapped at 80 K. P390 and P520 are in a pH-dependent equilibrium. The recovery of the D470 dark state proceeds via the two P480 subspecies P480a and P480b, which form a pH-dependent equilibrium. Formation and decay of these species is connected with changes in hydrogen bonding of Glu90. In a last step, major backbone rearrangement in P480b leads to reformation of the dark state. Alternatively the dark state can also be recovered by green light absorption of P520 (green arrow). Like P520, the P480b intermediate is photoreactive and can be converted by light to the early P500 intermediate (blue arrow), which would result in a shortcut of the photocycle. τ values (blue) of WT are indicated for pH 6. The structural alterations of ChR2 during the photocycle as indicated are deduced from the spectroscopic data.

References

    1. Nagel, G., Ollig, D., Fuhrmann, M., Kateriya, S., Musti, A. M., Bamberg, E., and Hegemann, P. (2002) Science 296 2395-2398 - PubMed
    1. Nagel, G., Szellas, T., Huhn, W., Kateriya, S., Adeishvili, N., Berthold, P., Ollig, D., Hegemann, P., and Bamberg, E. (2003) Proc. Natl. Acad. Sci. U. S. A. 100 13940-13945 - PMC - PubMed
    1. Sineshchekov, O. A., Jung, K. H., and Spudich, J. L. (2002) Proc. Natl. Acad. Sci. U. S. A. 99 8689-8694 - PMC - PubMed
    1. Govorunova, E. G., Jung, K. H., Sineshchekov, O. A., and Spudich, J. L. (2004) Biophys. J. 86 2342-2349 - PMC - PubMed
    1. Berthold, P., Tsunoda, S. P., Ernst, O. P., Mages, W., Gradmann, D., and Hegemann, P. (2008) Plant Cell 20 1665-1677 - PMC - PubMed

Publication types

LinkOut - more resources