. 2008 Dec;22(12):2677-88.
doi: 10.1210/me.2008-0097. Epub 2008 Oct 16.

A dual role for oncostatin M signaling in the differentiation and death of mammary epithelial cells in vivo

Affiliations

A dual role for oncostatin M signaling in the differentiation and death of mammary epithelial cells in vivo

Paul G Tiffen et al. Mol Endocrinol. 2008 Dec.

Abstract

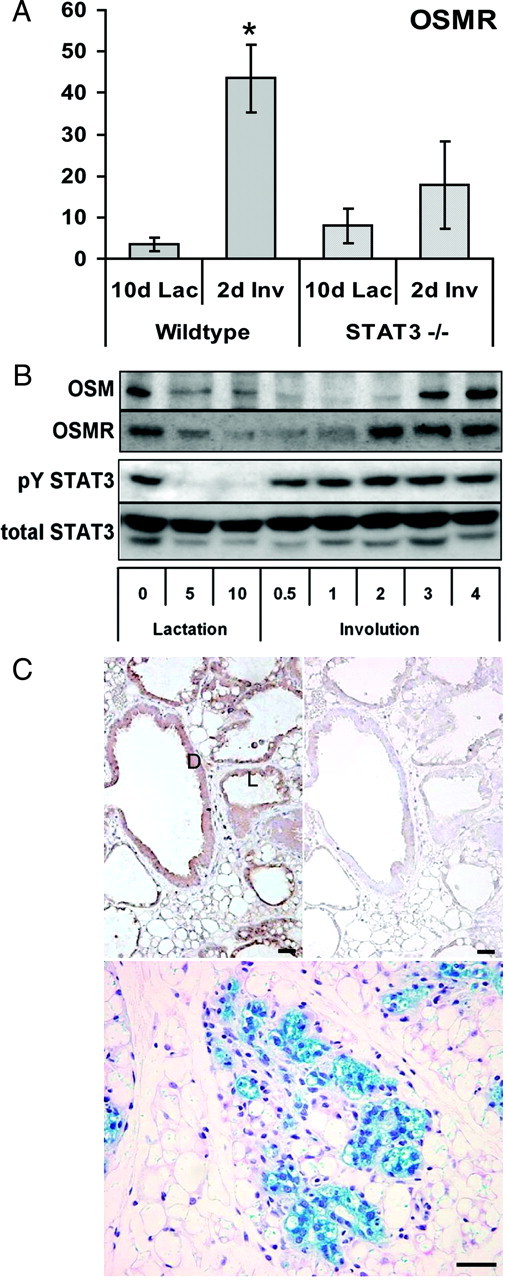
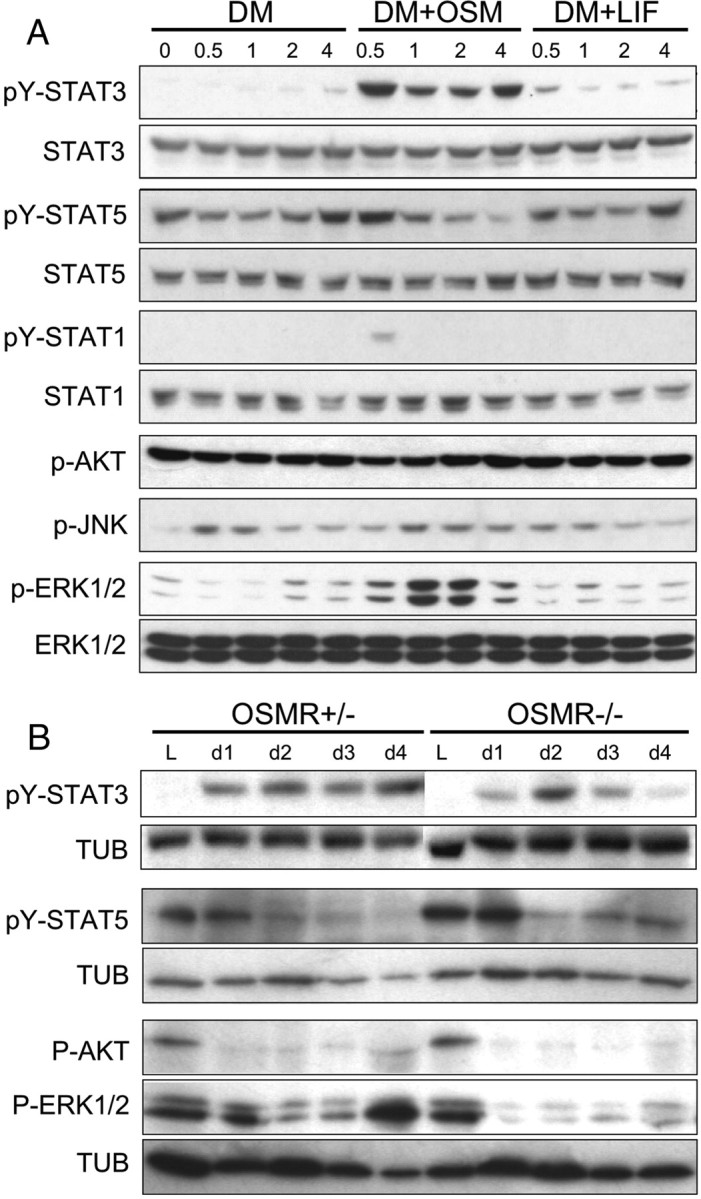
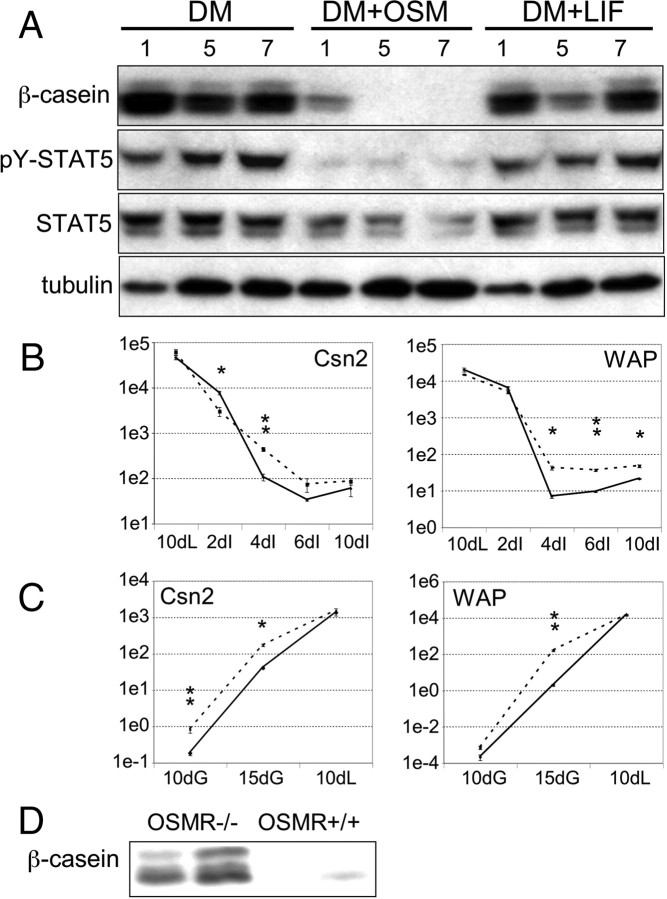
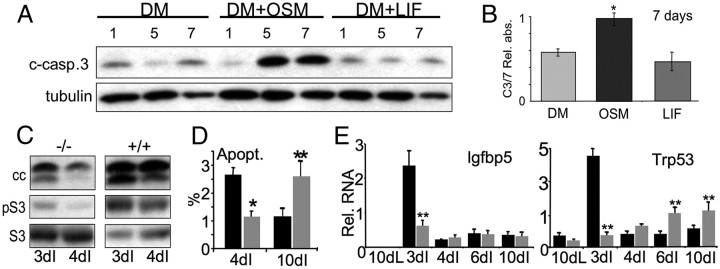
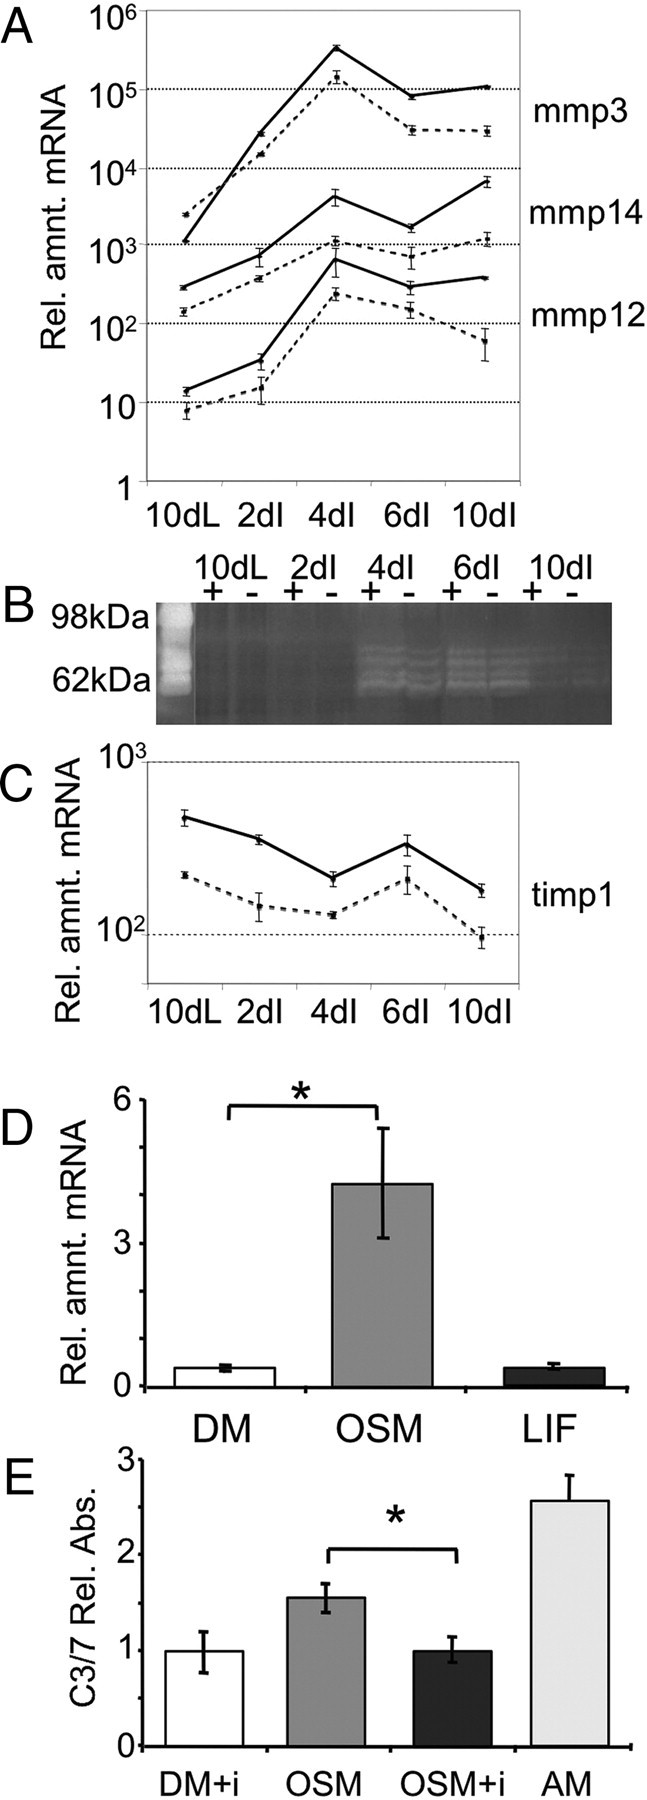
Recent studies in breast cancer cell lines have shown that oncostatin M (OSM) not only inhibits proliferation but also promotes cell detachment and enhances cell motility. In this study, we have looked at the role of OSM signaling in nontransformed mouse mammary epithelial cells in vitro using the KIM-2 mammary epithelial cell line and in vivo using OSM receptor (OSMR)-deficient mice. OSM and its receptor were up-regulated approximately 2 d after the onset of postlactational mammary regression, in response to leukemia inhibitory factor (LIF)-induced signal transducer and activator of transcription-3 (STAT3). This resulted in sustained STAT3 activity, increased epithelial apoptosis, and enhanced clearance of epithelial structures during the remodeling phase of mammary involution. Concurrently, OSM signaling precipitated the dephosphorylation of STAT5 and repressed expression of the milk protein genes beta-casein and whey acidic protein (WAP). Similarly, during pregnancy, OSM signaling suppressed beta-casein and WAP gene expression. In vitro, OSM but not LIF persistently down-regulated phosphorylated (p)-STAT5, even in the continued presence of prolactin. OSM also promoted the expression of metalloproteinases MMP3, MMP12, and MMP14, which, in vitro, were responsible for OSM-specific apoptosis. Thus, the sequential activation of IL-6-related cytokines during mammary involution culminates in an OSM-dependent repression of epithelial-specific gene expression and the potentiation of epithelial cell extinction mediated, at least in part, by the reciprocal regulation of p-STAT5 and p-STAT3.


Figures

Fig. 1.
Fig. 1.
OSMR Expression in the Murine Mammary Gland during Involution A, Quantitative RT-PCR of OSMR in STAT3−/− and control mammary glands harvested from mice at either 10 d lactation or 2 d involution. Results were normalized to cyclophilin (ppib). Error bars represent sd. *, Wild-type 10 d lactation (10d Lac) vs. wild-type 2 d involution (2d Inv) and wild-type 2d Inv vs. STAT3−/−: P = <0.05, Student’s t test). B, Western blots for OSMR, pY(705) STAT3 and total STAT3 (45 μg protein per sample) and OSM (60 μg) on a mammary gland time course (units are days); 0 lactation = day of parturition. To ensure equal loading the blot was stained using Ponceau’s stain. C, Immunohistochemistry (upper panel) of involuting mammary gland using mOSMR antibody (left) and serum control (right). D, Ductal epithelium; L, luminal epithelium. LacZ and H&E-stained section (lower panel) from OSMR+/− mouse harvested at d 4 of involution to confirm expression of the endogenous OSMR promoter. Bar, 50 μm.
Fig. 2.
Fig. 2.
OSM-Dependent Signaling in MEC in Vitro and in Vivo A, Western blots for phosphorylated and native forms of several signaling molecules in differentiated KIM-2 cells treated with mOSM or LIF for the times indicated (hours), with 30 μg total protein loaded for each sample. To ensure equal loading, the blots were stained using Ponceau’s stain. Antibodies to native STATs were reprobed on respective p-STAT blots. B, Western blots for phosphorylated STAT3, STAT5, ERK1/2, and Akt plus tubulin loading controls in mammary glands of OSMR−/− or heterozygous mice at the time points of lactation (L) or involution indicated (days), with 45 μg total protein loaded in each lane.
Fig. 3.
Fig. 3.
OSM Suppresses STAT5-Dependent Milk Gene Expression in Vitro and in Vivo A, Western blots for β-casein, STAT5, and tubulin on differentiated KIM-2 cells stimulated with mOSM or LIF for the times indicated (days), with 45 μg total protein loaded for each sample. B and C, Quantitative RT-PCR of β-casein (csn2) and WAP in OSMR−/− (dashed line) and control (bold line) mammary glands harvested from mice at time points during involution (B) and gestation (C). Results were normalized to cyclophilin (ppib). Error bars represent sem; n = 3 experiments. Significant differences in gene expression (paired t test) between knockout and control tissues at specific time points are indicated: *, P < 0.01; **, P < 0.001. D, Western blot of β-casein from two OSMR−/− and two wild-type mice at 15 d gestation, with 45 μg total protein loaded in each lane. Equal loading was ensured by staining the blot with Ponceau’s stain.
Fig. 4.
Fig. 4.
Effect of OSM on Long-Term MEC Apoptosis in Vitro and in Vivo A, Western blots for cleaved caspase-3 and tubulin on differentiated KIM-2 cells treated with mOSM or LIF, with 30 μg total protein loaded for each sample. B, Colorimetric assay for cleaved caspase-3/7 activity. Assay was performed on cell lysates from differentiated KIM-2 cells treated with either OSM or LIF. Error bars represent sd; n = 3. *, P < 0.01, Student’s t test. C, Western blots for cleaved caspase-3 and STAT3 in mammary glands of OSMR−/− or wild-type littermates harvested at d 3 and 4 involution, with 30 μg total protein pooled from three mice loaded in each lane. D, Immunofluorescence-based quantification of cleaved caspase-3-positive cells in mammary gland sections from OSMR−/− or wild-type mice harvested at 4 and 10 d involution. Results represent the mean percentage of positive cells in four fields of view per section (approximately 2000 cells) and three mice per genotype for each time point. Error bars represent sd. E, Quantitative RT-PCR for Trp53 and Igfbp5 on RNA samples (n = 4) harvested from OSMR+/− (black) and OSMR−/− (gray) mammary glands at 10 d lactation and 2, 4, 6, and 10 d involution. On the y-axis is relative RNA concentration normalized to ppiB. *, P < 0.001; **, P < 0.01, unpaired Student’s t test.
Fig. 5.
Fig. 5.
MMP Expression in OSMR−/− Mammary Glands and KIM-2 Cells A and C, Quantitative RT-PCR of MMPs (A) and TIMP-1 (C) in OSMR−/− (dashed line) and control (bold line) mammary glands harvested from mice at time points during involution (days). Results were normalized to cyclophilin (ppib). All PCR efficiencies were calculated to be greater than 85%. Error bars represent sem; n =3. Significant differences in gene expression (paired t test) between knockout and control tissues were observed at 4, 6, and 10 d involution for all three MMPs tested (P < 0.01). B, Zymography of MMP activity in OSMR knockout and heterozygous mammary glands at 10 d lactation and 2, 4, 6, and 10 d involution. Each sample represents a pool of three mice per time point. Equivalent loading was determined by Coomassie staining (not shown). An MMP-2/9 standard is used as a molecular marker. D, Quantitative RT-PCR of MMP3 in differentiated KIM-2 cells either untreated (DM) or treated with 25 ng/ml mOSM or 50 ng/ml LIF for 12 h. *, P = 0.004, Student’s t test. E, Colorimetric assay for cleaved caspase-3/7 activity. Differentiated KIM-2 cells were treated with 25 ng/ml OSM and/or 100 μm GM6001 MMP inhibitor for 5 d. Positive control cells were deprived of serum and hormones to induce apoptosis (AM). Values were normalized to untreated samples and represent means of three experiments. Error bars represent sd. *, P = 0.02, Student’s t test.
Fig. 6.
Fig. 6.
Mammary Histology in OSMR−/− Mice during Involution H&E-stained sections (A–F) and whole mounts (G and H) from abdominal mammary glands of OSMR−/− (right) and heterozygous littermates (left) at the following involution time points: 6 d (A and B), 10 d (C and D), and 20 d (E–H). Bars, 200 μm (A–F) and 2.5 mm (G and H).
Fig. 7.
Fig. 7.
Epithelial Content in OSMR−/− Mice during Involution The relative surface area of epithelial structures was plotted as a percentage of the total surface area of mammary sections visualized at ×4 magnification. A minimum of three mice per time point (6, 10, and 20 d involution), per genotype (OSMR−/− and heterozygous littermates) were plotted along with the mean ± sem (bars). Alternative methods of measuring epithelial content confirmed the same trends (supplemental Fig. 7). *, Student’s t test, OSMR vs. wild-type 10 d involution, P = 0.0019.

Similar articles

Cited by

References

    1. Gearing DP 1993. The leukemia inhibitory factor and its receptor. Adv Immunol 53:31–58 - PubMed
    1. Rose TM, Bruce AG 1991. Oncostatin M is a member of a cytokine family that includes leukemia inhibitory factor, granulocyte colony-stimulating factor, and interleukin 6. Proc Natl Acad Sci USA 88:8641–8647 - PMC - PubMed
    1. Zarling JM, Shoyab M, Marquardt H, Hanson MB, Lioubin MN, Todaro GJ 1986. Oncostatin M: a growth regulator produced by differentiated histiocytic lymphoma cells. Proc Natl Acad Sci USA 83:9739–9743 - PMC - PubMed
    1. Tanaka M, Miyajima A 2003. Oncostatin M, a multifunctional cytokine. Rev Physiol Biochem Pharmacol 149:39–52 - PubMed
    1. Bruce AG, Hoggatt IH, Rose TM 1992. Oncostatin M is a differentiation factor for myeloid leukemia cells. J Immunol 149:1271–1275 - PubMed

Publication types

MeSH terms