

Sugary soda consumption and albuminuria: results from the National Health and Nutrition Examination Survey, 1999-2004
- PMID: 18927611
- PMCID: PMC2562987
- DOI: 10.1371/journal.pone.0003431
Sugary soda consumption and albuminuria: results from the National Health and Nutrition Examination Survey, 1999-2004
Abstract
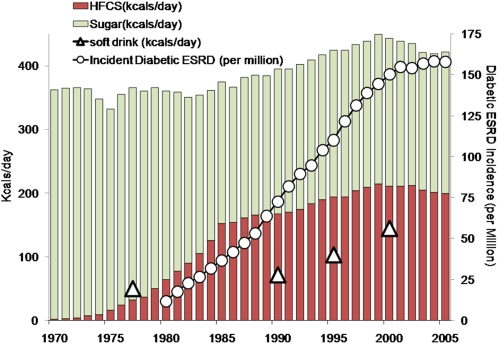
Background: End-stage renal disease rates rose following widespread introduction of high fructose corn syrup in the American diet, supporting speculation that fructose harms the kidney. Sugar-sweetened soda is a primary source of fructose. We therefore hypothesized that sugary soda consumption was associated with albuminuria, a sensitive marker for kidney disease.
Methodology/principal findings: Design was a cross-sectional analysis. Data were drawn from the National Health and Nutrition Examination Survey (NHANES), 1999-2004. The setting was a representative United States population sample. Participants included adults 20 years and older with no history of diabetes mellitus (n = 12,601); after exclusions for missing outcome and covariate information (n = 3,243), the analysis dataset consisted of 9,358 subjects. Exposure was consumption of two or more sugary soft drinks, based on 24-hour dietary recall. The main outcome measure was Albuminuria, defined by albumin to creatinine ratio cutpoints of >17 mg/g (males) and >25 mg/g (females). Logistic regression adjusted for confounders (diet soda, age, race-ethnicity, gender, poverty). Interactions between age, race-ethnicity, gender, and overweight-obesity were explored. Further analysis adjusted for potential mediators: energy intake, basal metabolic rate, obesity, hypertension, lipids, serum uric acid, smoking, energy expenditure, and glycohemoglobin. Alternative soda intake definitions and cola consumption were employed.
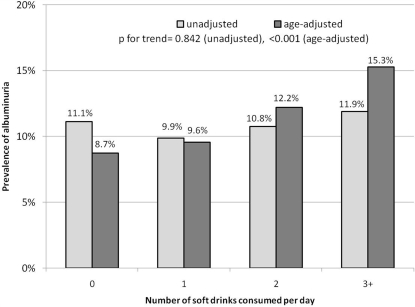
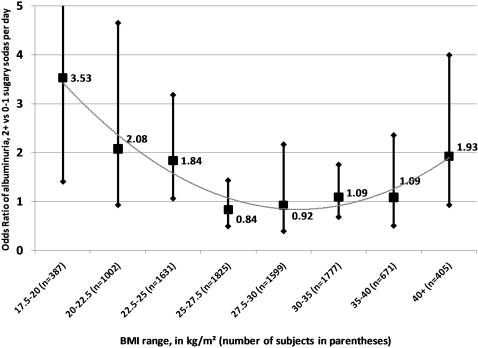
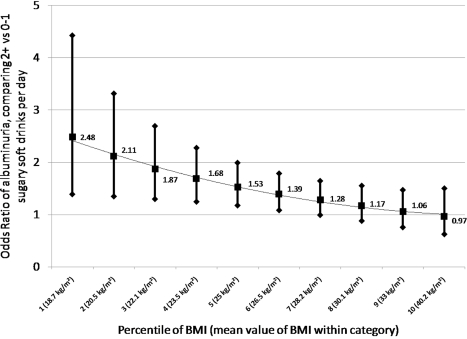
Results: Weighted albuminuria prevalence was 11%, and 17% consumed 2+ sugary soft drinks/day. The confounder-adjusted odds ratio for sugary soda was 1.40 (95% confidence interval: 1.13, 1.74). Associations were modified by gender (p = 0.008) and overweight-obesity (p = 0.014). Among women, the OR was 1.86 (95% CI: 1.37, 2.53); the OR among males was not significant. In the group with body mass under 25 kg/m(2), OR = 2.15 (95% confidence interval: 1.42, 3.25). Adjustment for potential mediators and use of alternative definitions of albuminuria and soda consumption did not appreciably change results. Diet sodas were not associated with albuminuria.
Conclusions: Findings suggest that sugary soda consumption may be associated with kidney damage, although moderate consumption of 1 or fewer sodas does not appear to be harmful. Additional studies are needed to assess whether HFCS itself, overall excess intake of sugar, or unmeasured lifestyle and confounding factors are responsible.
Conflict of interest statement
Figures
Similar articles
-
Beverage intake among preschool children and its effect on weight status.Pediatrics. 2006 Oct;118(4):e1010-8. doi: 10.1542/peds.2005-2348. Pediatrics. 2006. PMID: 17015497
-
Intake of high fructose corn syrup sweetened soft drinks is associated with prevalent chronic bronchitis in U.S. Adults, ages 20-55 y.Nutr J. 2015 Oct 16;14:107. doi: 10.1186/s12937-015-0097-x. Nutr J. 2015. PMID: 26474970 Free PMC article.
-
Excess free fructose, high-fructose corn syrup and adult asthma: the Framingham Offspring Cohort.Br J Nutr. 2018 May;119(10):1157-1167. doi: 10.1017/S0007114518000417. Epub 2018 Mar 28. Br J Nutr. 2018. PMID: 29587887
-
Dietary sugar and artificial sweetener intake and chronic kidney disease: a review.Adv Chronic Kidney Dis. 2013 Mar;20(2):157-64. doi: 10.1053/j.ackd.2012.12.005. Adv Chronic Kidney Dis. 2013. PMID: 23439375 Review.
-
Does consumption of high-fructose corn syrup beverages cause obesity in children?Pediatr Obes. 2013 Aug;8(4):249-54. doi: 10.1111/j.2047-6310.2013.00173.x. Epub 2013 Apr 29. Pediatr Obes. 2013. PMID: 23630060 Review.
Cited by
-
Sugar-sweetened soda consumption, hyperuricemia, and kidney disease.Kidney Int. 2010 Apr;77(7):609-16. doi: 10.1038/ki.2009.500. Epub 2009 Dec 23. Kidney Int. 2010. PMID: 20032963 Free PMC article.
-
Aging-associated renal disease in mice is fructokinase dependent.Am J Physiol Renal Physiol. 2016 Oct 1;311(4):F722-F730. doi: 10.1152/ajprenal.00306.2016. Epub 2016 Jul 27. Am J Physiol Renal Physiol. 2016. PMID: 27465991 Free PMC article.
-
Increased fructose associates with elevated blood pressure.J Am Soc Nephrol. 2010 Sep;21(9):1543-9. doi: 10.1681/ASN.2009111111. Epub 2010 Jul 1. J Am Soc Nephrol. 2010. PMID: 20595676 Free PMC article.
-
Low-fructose diet lowers blood pressure and inflammation in patients with chronic kidney disease.Nephrol Dial Transplant. 2012 Feb;27(2):608-12. doi: 10.1093/ndt/gfr223. Epub 2011 May 25. Nephrol Dial Transplant. 2012. PMID: 21613382 Free PMC article.
-
The impact of fructose on renal function and blood pressure.Int J Nephrol. 2011;2011:315879. doi: 10.4061/2011/315879. Epub 2011 Jul 17. Int J Nephrol. 2011. PMID: 21792388 Free PMC article.
References
-
- Muntner P, Coresh J, Powe NR, Klag MJ. The contribution of increased diabetes prevalence and improved myocardial infarction and stroke survival to the increase in treated end-stage renal disease. J Am Soc Nephrol. 2003;14:1568–1577. - PubMed
-
- Hsu CY, McCulloch CE, Iribarren C, Darbinian J, Go AS. Body mass index and risk for end-stage renal disease. Ann Intern Med. 2006;144:21–28. - PubMed
-
- Kramer H, Luke A, Bidani A, Cao G, Cooper R, et al. Obesity and prevalent and incident CKD: the Hypertension Detection and Follow-Up Program. Am J Kidney Dis. 2005;46:587–594. - PubMed
-
- Fox CS, Larson MG, Leip EP, Culleton B, Wilson PW, et al. Predictors of new-onset kidney disease in a community-based population. Jama. 2004;291:844–850. - PubMed
-
- Gelber RP, Kurth T, Kausz AT, Manson JE, Buring JE, et al. Association between body mass index and CKD in apparently healthy men. Am J Kidney Dis. 2005;46:871–880. - PubMed
MeSH terms
LinkOut - more resources
Full Text Sources
