. 2008;3(10):e3449.
doi: 10.1371/journal.pone.0003449. Epub 2008 Oct 17.

Biological function and molecular mapping of M antigen in yeast phase of Histoplasma capsulatum

Affiliations

Biological function and molecular mapping of M antigen in yeast phase of Histoplasma capsulatum

Allan Jefferson Guimarães et al. PLoS One. 2008.

Abstract

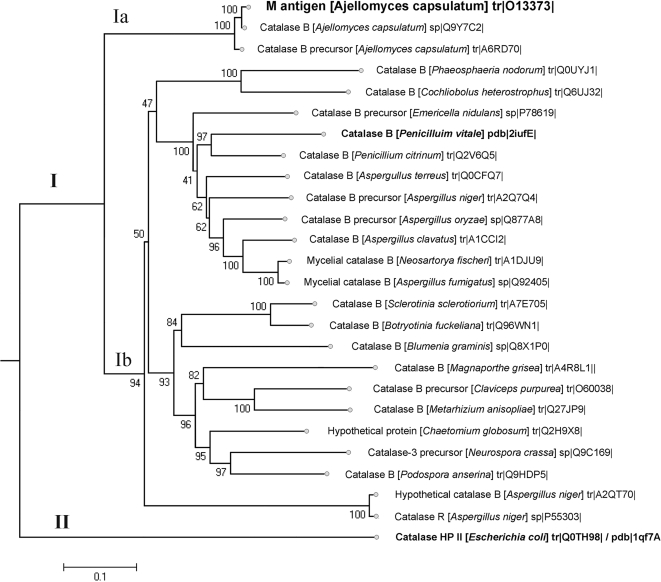
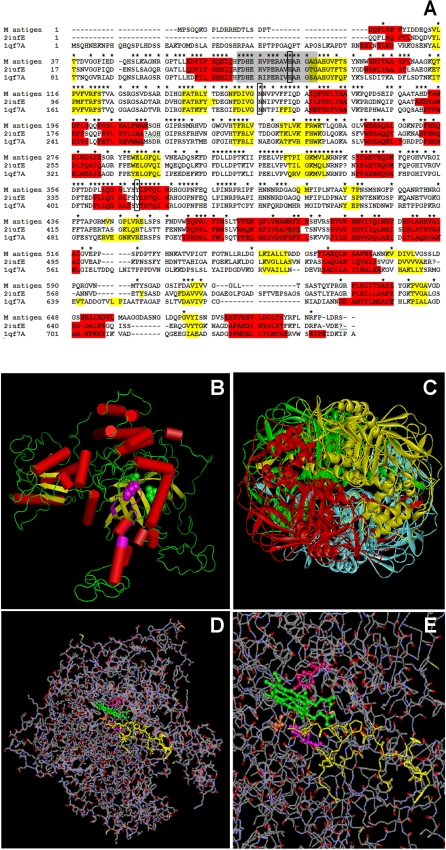
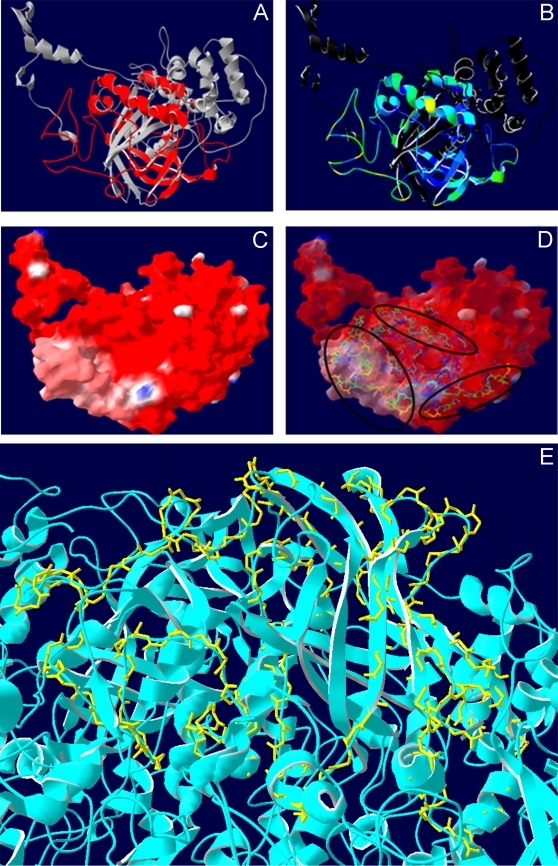
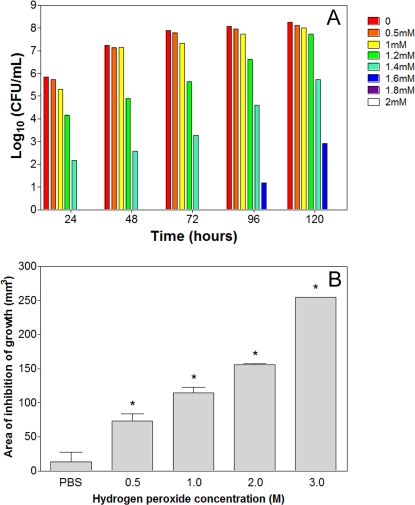
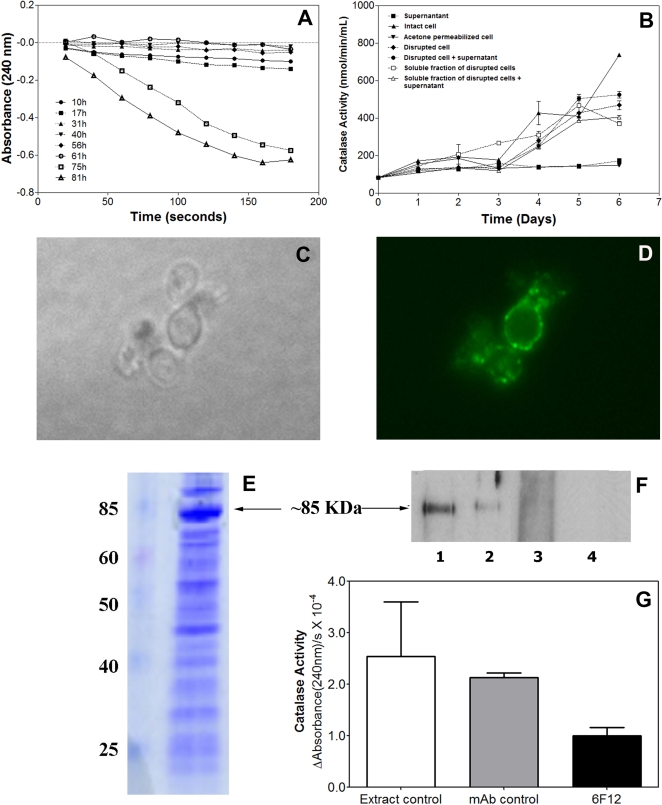
Histoplasmosis, due to the intracellular fungus Histoplasma capsulatum, can be diagnosed by demonstrating the presence of antibodies specific to the immunodominant M antigen. However, the role of this protein in the pathogenesis of histoplasmosis has not been elucidated. We sought to structurally and immunologically characterize the protein, determine yeast cell surface expression, and confirm catalase activity. A 3D-rendering of the M antigen by homology modeling revealed that the structures and domains closely resemble characterized fungal catalases. We generated monoclonal antibodies (mAbs) to the protein and determined that the M antigen is present on the yeast cell surface and in cell wall/cell membrane preparations. Similarly, we found that the majority of catalase activity was in extracts containing fungal surface antigens and that the M antigen is not significantly secreted by live yeast cells. The mAbs also identified unique epitopes on the M antigen. The localization of the M antigen to the cell surface of H. capsulatum yeast and the characterization of the protein's major epitopes have important implications since it demonstrates that although the protein may participate in protecting the fungus against oxidative stress it is also accessible to host immune cells and antibody.


Conflict of interest statement

Competing Interests: The authors have declared that no competing interests exist.

Figures

Figure 1
Figure 1. Phylogenetic analysis and dendrogram comparing the amino acid sequences of several catalase-peroxidases from the Ascomycota class and catalases used to construct the M antigen model (shown in bold).
Swiss-Prot (sp) accession numbers for each sequence are shown on the right. Alignment of 26 catalase sequences was done using CLUSTAL W. The sequences were subjected to phylogenetic analysis using neighbour-join with maximum parsimony and minimum evolution, and length of the lines and distance between the clusters determined. The numbers on the branches are bootstrap values obtained with 500 replicates and indicate the frequency that all species to the right appear as a monophyletic cluster.
Figure 2
Figure 2. Studies of homology modeling of the M antigen.
(A) Sequence alignment by CLUSTAL-W and comparison of catalases of Histoplasma capsulatum (M antigen), Penicillium vitale (2iufE) and Escherichia coli (1qf7A) used in the construction of the 3-D model of the M antigen. Amino acids are shown in single-letter code and stars indicate conserved amino acids residues and exact identity among the sequences. Residues highlighted in red and in yellow show α-helix and β-sheet secondary structures, respectively, determined by JPRED. Residues aligned in gray represent the catalase proximal active site signature. Boxes indicate the most favorable sites for heme ligand docking (H83, N156, Y370). Numbering of the residues and identifications for each protein are indicated to the left of the protein sequences. (B) Hypothetical model of the M antigen based in structure homology with other catalases. The proximal active site signature is shown in pink within the sequence. Cylinders represent alpha helixes and arrows, beta sheets. (C) Hypothetical model of the M antigen as a tetramer showing the N-terminal (blue), barrel shaped domain (red), binding domain (yellow) and helicoidal domain (green). (D) Structure showing the signature site of M antigen as a catalase and (E) Folded structure showing the insertion of the heme group (green) by docking, showing the respective interaction sites, H83 (magenta), N156 (orange), Y370 (pink).
Figure 3
Figure 3. Topology studies of fragment 2.
(A) M antigen ribbon representation of the molecular model, with F2 colored in red. (B) F2 structure colored for solvent accessibility where blue indicates least accessibility. (C) Mapping of the surface of the M antigen. The surface has been made transparent to allow the perception of the internal protein architecture and colored according to the Coulombic electrostatic potential: red, negative; grey, neutral; and blue, positive. (D) Top view of the F2 on the surface of the M antigen model with ribbons colored by accessibility (from blue to red indicating less to more, respectively). Circles indicate the regions with highest antigenic index and accessibility. (E) Top view of F2 (backbone-yellow) with the ribbon molecular model of the tetramer form of the M antigen. The secondary structure, solvent accessibility and molecular surfaces were calculated in SwissPDB Viewer v3.7.
Figure 4
Figure 4. Pattern of immunoreactivity of the M antigen fragments and determination of antibodies specificity in sera of patients with histoplasmosis.
Figure shows the distribution of patients' sera tested for each immunoglobulin class/fragment. Each symbol represents a single individual's serum. Dashed lines (……) represent the error bars and indicate a 95% confidence level; P values were determined using the One-way ANOVA test.
Figure 5
Figure 5. Effects of oxidative stress by hydrogen peroxide to H. capsulatum.
(A) Susceptibility of yeasts to different H2O2 concentrations during growth of yeasts in HAM F-12 liquid medium by measurement of cell viability by CFU determinations, with no difference among concentrations up to 1 mM (p<0.05) at each time interval. Results show the average of three independent experiments. (B) Halo assay comparing the hydrogen peroxide sensitivity of strain G217B. Liquid culture was grown to mid log phase and plated on HAM-F12 agar plates to form a yeasts lawn. A filter disc containing the indicated concentration of hydrogen peroxide was placed at the center of each plate. After incubation for 7 days, the clear zone surrounding each filter disc was measured (inhibition of growth) and plotted versus concentration of H2O2. Increasing concentrations of H2O2 show more inhibition of growth (p<0.001). Each experiment was performed in triplicate and repeated at least three times.
Figure 6
Figure 6. Catalase activity in G217B yeast cells.
(A) Measurement of catalase activity during growth of yeasts by measuring the decomposition of H2O2 at 240 nm. Decreased absorbance corresponds to breakdown of hydrogen peroxide due to catalase activity. (B) Catalase activity in different cell fractions and its variation over time. Error bars indicate confidence level (95%); P values were determined using One-way ANOVA test. (p<0.001). Each sample was tested in duplicate and the experiment was repeated three times. (C) Light and (D) immunofluorescence microscopy of yeast cells showing the immunolocalization of M antigen on the surface of H. capsulatum using the 8H2 mAb. Similar reactivity occurred with mAb 6F12 and 7C7. (E) SDS-PAGE of the cell wall/membrane yeast extract preparation. (F) Immunoblot showing the reactivity of mAbs against the rM antigen to cell wall/membrane yeast extract. Lines 1, 2 and 3– mAbs 8H2, 6F12 and 7C7 against the M antigen, Line 4 – Irrelevant immunoglobulin as a negative control. (G) Co-immunoprecipitation of M antigen from the cell wall/membrane extracts using mAb 6F12 showing a reduction of the catalase activity of this fraction comparing to the PBS and isotype control.
Figure 7
Figure 7. Detection of M antigen during growth of yeast cells.
(A) Growth of Histoplasma capsulatum in HAMF-12 medium enumerated by hemocytometer and viability of G217B yeast cells determined by propidium iodine and CFU plating. (B) LDH activity in supernatant of culture and cytoplasm fractions of yeast cells during growth in the same conditions. Results show the average of three independent experiments. (C) Detection of M antigen in the supernatant during growth in culture by immunoblot using mAb 8H2.

Similar articles

Cited by

References

    1. Guimarães AJ, Nosanchuk JD, Zancope-Oliveira RM. Diagnosis of Histoplasmosis. Brazilian Journal of Microbiology. 2006;37:1–13. - PMC - PubMed
    1. Maresca B, Kobayashi GS. Dimorphism in Histoplasma capsulatum: a model for the study of cell differentiation in pathogenic fungi. Microbiol Rev. 1989;53:186–209. - PMC - PubMed
    1. Medoff G, Kobayashi GS, Painter A, Travis S. Morphogenesis and pathogenicity of Histoplasma capsulatum. Infect Immun. 1987;55:1355–1358. - PMC - PubMed
    1. Eissenberg LG, Goldman WE. Histoplasma variation and adaptive strategies for parasitism: new perspectives on histoplasmosis. Clin Microbiol Rev. 1991;4:411–421. - PMC - PubMed
    1. Johnson CH, Klotz MG, York JL, Kruft V, McEwen JE. Redundancy, phylogeny and differential expression of Histoplasma capsulatum catalases. Microbiology. 2002;148:1129–1142. - PubMed

Publication types

MeSH terms