. 2008 Oct;4(10):e1000182.
doi: 10.1371/journal.ppat.1000182. Epub 2008 Oct 17.

High-resolution functional profiling of hepatitis C virus genome

Affiliations

High-resolution functional profiling of hepatitis C virus genome

Vaithilingaraja Arumugaswami et al. PLoS Pathog. 2008 Oct.

Abstract

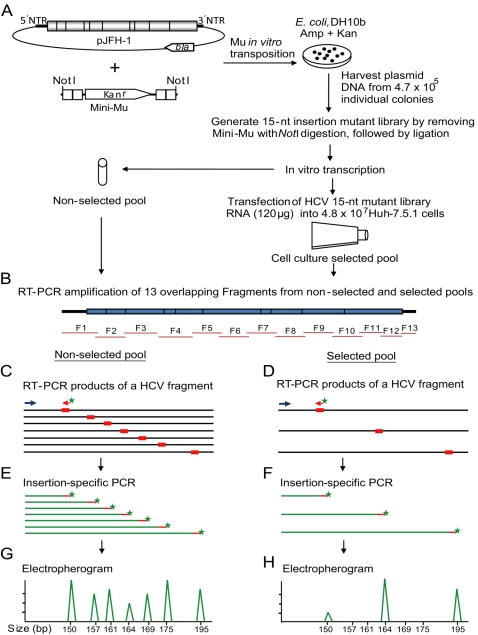
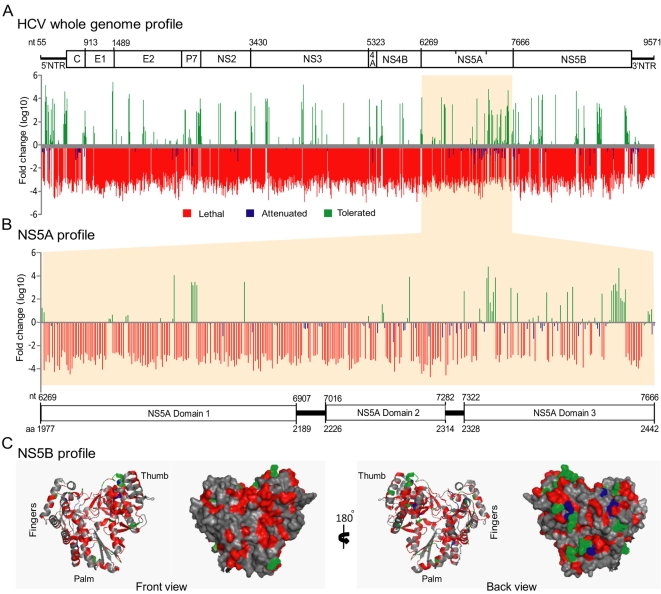
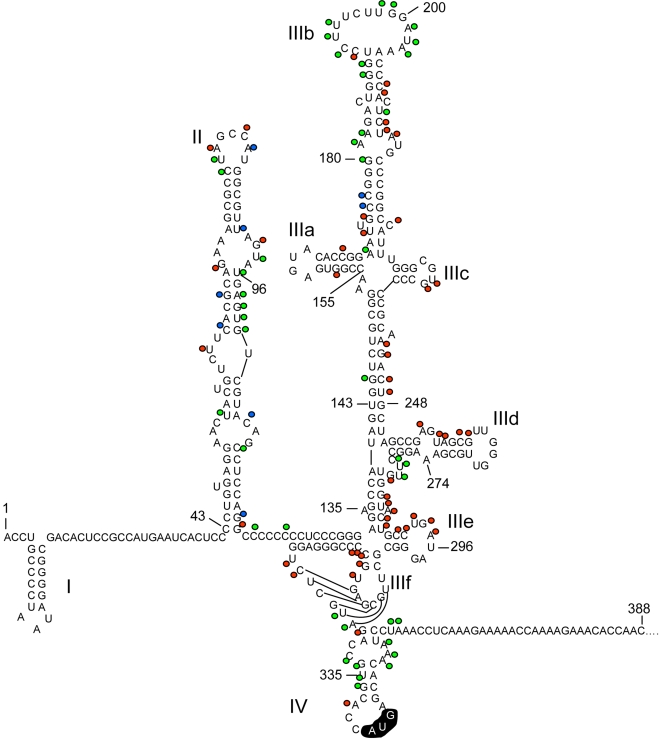
Hepatitis C virus is a leading cause of human liver disease worldwide. Recent discovery of the JFH-1 isolate, capable of infecting cell culture, opens new avenues for studying HCV replication. We describe the development of a high-throughput, quantitative, genome-scale, mutational analysis system to study the HCV cis-elements and protein domains that are essential for virus replication. An HCV library with 15-nucleotide random insertions was passaged in cell culture to examine the effect of insertions at each genome location by insertion-specific fluorescent-PCR profiling. Of 2399 insertions identified in 9517 nucleotides of the genome, 374, 111, and 1914 were tolerated, attenuating, and lethal, respectively, for virus replication. Besides identifying novel functional domains, this approach confirmed other functional domains consistent with previous studies. The results were validated by testing several individual mutant viruses. Furthermore, analysis of the 3' non-translated variable region revealed a spacer role in virus replication, demonstrating the utility of this approach for functional discovery. The high-resolution functional profiling of HCV domains lays the foundation for further mechanistic studies and presents new therapeutic targets as well as topological information for designing vaccine candidates.


Conflict of interest statement

The authors have declared that no competing interests exist.

Figures

Figure 1
Figure 1. Schematic diagram depicting the various steps involved in Hepatitis C virus functional profiling.
(A) The plasmid carrying the JFH-1 HCV genome is subjected to in vitro mutagenesis by using the mini-Mu transposon, then selected in E. coli bacteria. The harvested mutant plasmids are subjected to NotI restriction enzyme digestion to remove the transposon body, followed by ligation resulting in the generation of a 15-nt insertion plasmid library. Subsequently, this mutant plasmid library is in vitro transcribed and used as a non-selected input pool for functional profiling analysis. The in vitro transcribed RNA library is delivered into Huh-7.5.1 cells for genetic selection. The total RNA harvested from the transfected cells (selected pool) as well as non-selected pool RNA are subjected to functional profiling analysis. (B) Followed by selection, the mutant HCV genome from the non-selected input pool and the selected pool are reverse-transcribed and 13 overlapping fragments (F1 to F13) are PCR amplified. (C, D) The purified PCR products from non-selected and selected pools are used as templates for a second PCR using one of the HCV fragment-specific primers (blue arrow) and a fluorescently labeled insertion-specific primer (red arrow with green star). (E, F) The fluorescently-labeled PCR products from input and selected pools are analyzed by a 96-capillary genotyper. The processed data are either visualized by electropherograms (G, H) or exported as a data file. The phenotype for each insertion is calculated by comparing the corresponding peak areas of selected and non-selected pools.
Figure 2
Figure 2. Electropherogram depicting the location of 15-nt insertions in p7-NS2 region and the mutant population replication dynamics during selection.
Each peak (X-axis) represents the location of a 15-nt insertion in the p7-NS2 region, and the fluorescent signal intensity (Y-axis) indicates the abundance of each 15-nt insertion mutant. The number at the top of the figure corresponds to the JFH-1 genome position of the p7-NS2 region. The electropherogram panels show the insertion profile of the mutant plasmid library (DNA input), in vitro transcribed RNA library (RNA input), and Huh-7.5.1 cell culture selected mutant viral library [selection 2, 4, 10, 16, and 21 days post-transfection (dpt)]. The complexity of the library is similar in DNA input, RNA input, 2 dpt and 4 dpt. Most of the 15-nt insertion mutants have been negatively selected at 10 dpt. Note that the HCV mutants containing 15-nt insertions around p7-NS2 junctions have shown strong positive selection. Asterisks indicate an artifact peak generated during data processing. To better visualize the short peaks, the fluorescent signal intensity scale was set at 2000; hence some of the tall peaks are shown out of scale.
Figure 3
Figure 3. Genome scale functional profile of HCV.
Graphical representation of the location and phenotype of 15-nt insertions in the HCV genome are shown. For each 15-nt insertion mutant, the ratio of peak area was calculated between selected and non-selected pools and plotted in a bar graph. The lethal phenotype (critical region, red bar) is an absence of an insertion mutant in the selected population. The attenuated phenotype (less critical region, blue bar) is an over two-fold reduction in replication. The tolerated phenotype (dispensable region, green bar) is replication competent. (A) The final assembly shows the fold change (log10) and locations of insertions in the HCV genome. A cartoon of the HCV regions is aligned at the top of graph to show the boundary of each region. The numbering corresponds to the nucleotide (nt) position of JFH-1 genome. (B) The location and phenotype of insertions at the NS5A region are shown. A schematic diagram of the NS5A domains is aligned with the functional profile graph. Note that many insertions at domain 3 are tolerated. (C) The crystal structure of NS5B (PDB accession code 1C2P), RNA dependent RNA polymerase, displays the functional profiling phenotypes. The front and back views of ribbon and surface diagrams of the NS5B monomer is shown. The fingers, thumb, and palm sub-domains are indicated. The amino acid residues are color coded for insertion phenotypes: red (lethal), blue (attenuating), green (tolerated), and grey (no insertion). Insertions in the sub-domains forming the catalytic active site were lethal (front view) for virus replication, whereas many insertions on the outer surface (back view) were tolerated. The crystal structure was analyzed using PyMOL Viewer. aa, amino acid.
Figure 4
Figure 4. Functional Profiles of the JFH-1 HCV 5′NTR cis-elements.
The predicted secondary structures of 5′NTR are shown. The numbers correspond to the JFH-1 genome sequence. The locations of 15-nt insertions are indicated as filled circles. The colors of the filled circles represent the phenotypes: lethal (red), attenuating (blue), and tolerated (green). 5′NTR stem loop domains (I, II, III and IV) are shown. The loop region of IIIb and stem loop domain IV had many tolerated insertions. The translation initiation codon AUG is highlighted.
Figure 5
Figure 5. Functional Profiles of the JFH-1 HCV 5BSL3 CRE and 3′NTR cis-elements.
The stem loop structures are shown. The colors of the filled circles represent the phenotypes: lethal (red), attenuating (blue), and tolerated (green). Insertions at 5BSL- 3.1 and 3.2 were lethal for virus replication. Many insertions at the bulge region between CRE 5BSL- 3.2 and 3.3 were tolerated. The kissing-loop interaction between CRE 5BSL3.2, and 3′SL2 is depicted with dotted lines. The 3′NTR predicted variable region stem loop structures (VSL1 and VSL2), poly (U/UC) tract, and 3′X tail stem loop structures are shown. Many insertions at VSL2 were tolerated and attenuating. The stop codon UAG is highlighted. All the insertions at poly-U tract were lethal.
Figure 6
Figure 6. Validating the HCV functional profiling phenotypes by individual mutant viruses.
(A) Nucleotide and amino acid sequence information for the 15-nt insertions engineered in the individual mutant NRLFC reporter viruses is shown. The inserted nucleotide/amino acid sequences are shown in bold face. The genomic position of nucleotide and amino acid residues are indicated. (B) Analysis of viral genome replication of mutant viruses. 10 µg of in vitro transcribed genomic RNA of wild-type NRLFC reporter virus and the mutant reporter viruses were individually introduced into Huh-7.5.1 cells by electroporation. The mutant reporter viruses lacking envelope (env-null) and polymerase activity (pol-null) are included as controls. The transfected cells were lysed at indicated time points using Promega passive lysis buffer, and the levels of Renilla luciferase were quantified. The experiment was done in triplicate and the mean values with standard deviation of Renilla luciferase values (RLV) are presented as a bar graph in log10 scale. (C) Measuring the production of infectious viral particles by mutant viruses. The cell-free supernatants harvested at 48 and 96 hours post-transfection (hpt) were inoculated onto naïve Huh-7.5.1 cells. At 48 hpt the cells were lysed and the Renilla luciferase activities were assayed. The mean RLV with standard deviations are shown in the graph. The replication deficient mutants show only background level of luciferase activity. (D) The expression of HCV non-structural and structural proteins. The protein lysates obtained at 96 hpt were subjected to western blotting. The HCV core and NS3 antigens were detected by primary mouse monoclonal antibodies and secondary goat-anti mouse IgG conjugated with HRP. β-actin was included as a loading control.
Figure 7
Figure 7. Analysis of 3′NTR Variable Region in HCV replication.
(A) Nucleotide sequence of JFH-1 3′NTR variable region and the mutations engineered in the individual mutant viruses are depicted. The genome position of the nucleotides is indicated. The sequence that is conserved across all the genotypes is underlined. The deleted polynucleotide regions are shown in dotted lines. The substituted heterologous polynucleotides are in italics. 15-nt insertion sequence is boxed. Due to space limitation, only a partial sequence is shown for 3′NTR-9463 mutant. (B) Analysis of viral genome replication of mutant reporter viruses. The mean Renilla luciferase values (RLV) with standard deviations are shown in the graph (log10 scale). (C) Measuring the production of infectious viral particles by mutant reporter viruses. The mutants deficient in production of infectious particles show only a background level of luciferase activity. (D) Western blotting analysis of viral proteins, NS3 and core, expression. (E) Comparison of J6/JFH-C mutant viral infectivity. The virus titer (ffu/ml) of cell-free supernatant collected at 48 and 96 hpt of J6/JFH-C based mutants' transfected cell culture was measured by infecting naïve Huh-7.5.1 cells. Mean values and standard deviations are shown in the graph. (F) Comparison of J6/JFH-C mutant viral genome replication. At 4, 48, and 96 hpt total cellular RNAs were harvested and subjected to RT-qPCR. The genome copy numbers per µg of RNA are presented. (G) Immunofluorescence assay. At 48 and 96 hpt the cells were fixed and stained for HCV core antigen. The cell nuclei were visualized by DAPI staining. For B, C, and D experimental details see Figure 6 legend.

References

    1. Alter MJ. Epidemiology of hepatitis C virus infection. World J Gastroenterol. 2007;13:2436–2441. - PMC - PubMed
    1. Kiyosawa K, Sodeyama T, Tanaka E, Gibo Y, Yoshizawa K, et al. Interrelationship of blood transfusion, non-A, non-B hepatitis and hepatocellular carcinoma: analysis by detection of antibody to hepatitis C virus. Hepatology. 1990;12:671–675. - PubMed
    1. Choo QL, Kuo G, Weiner AJ, Overby LR, Bradley DW, et al. Isolation of a cDNA clone derived from a blood-borne non-A, non-B viral hepatitis genome. Science. 1989;244:359–362. - PubMed
    1. Lindenbach BD, Thiel HJ, Rice CM. Flaviviridae: viruses and their replication. In: Knipe DM, Howley PM, editors. Fields Virology. 5 ed. Philadelphia, PA: Lippincott-Raven Publishers; 2007. pp. 1101–1152.
    1. Hijikata M, Kato N, Ootsuyama Y, Nakagawa M, Shimotohno K. Gene mapping of the putative structural region of the hepatitis C virus genome by in vitro processing analysis. Proc Natl Acad Sci U S A. 1991;88:5547–5551. - PMC - PubMed

Publication types