. 2008 Oct;4(10):e1000226.
doi: 10.1371/journal.pgen.1000226. Epub 2008 Oct 17.

Effects of aneuploidy on genome structure, expression, and interphase organization in Arabidopsis thaliana

Affiliations

Effects of aneuploidy on genome structure, expression, and interphase organization in Arabidopsis thaliana

Bruno Huettel et al. PLoS Genet. 2008 Oct.

Abstract

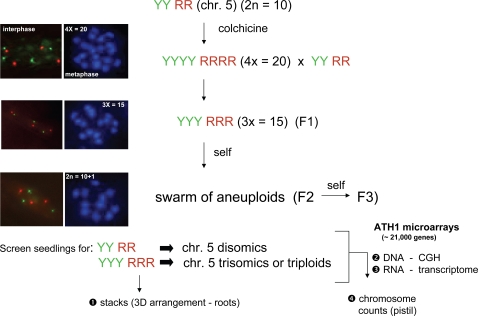
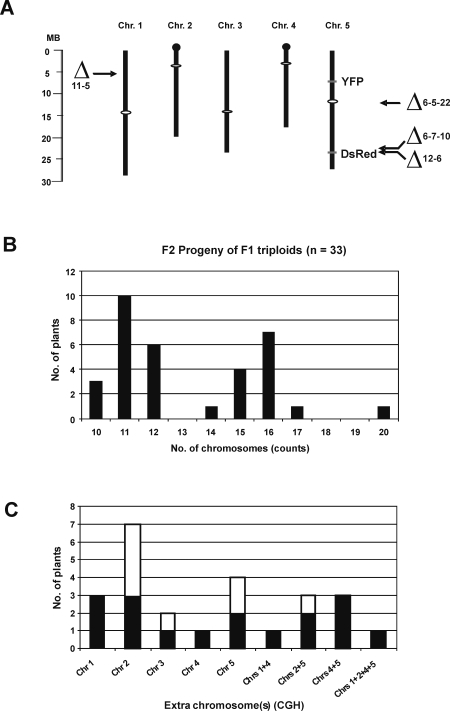
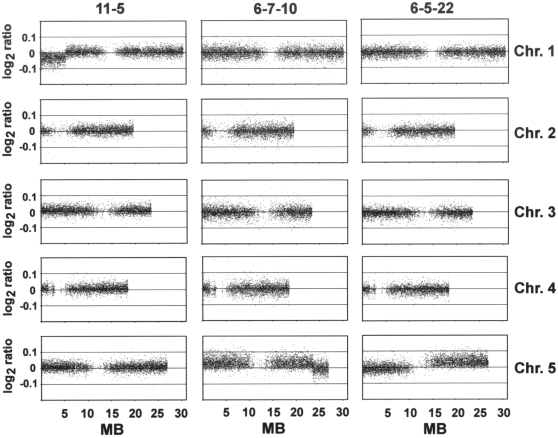
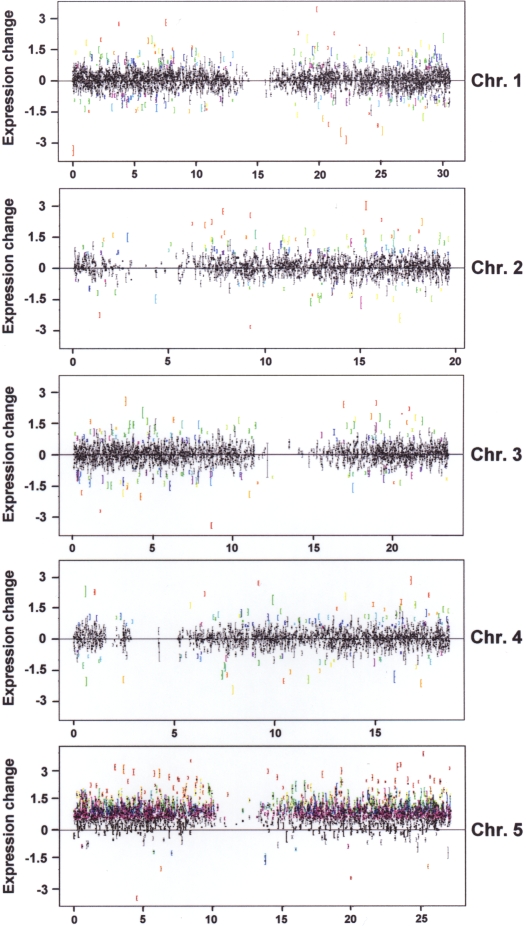
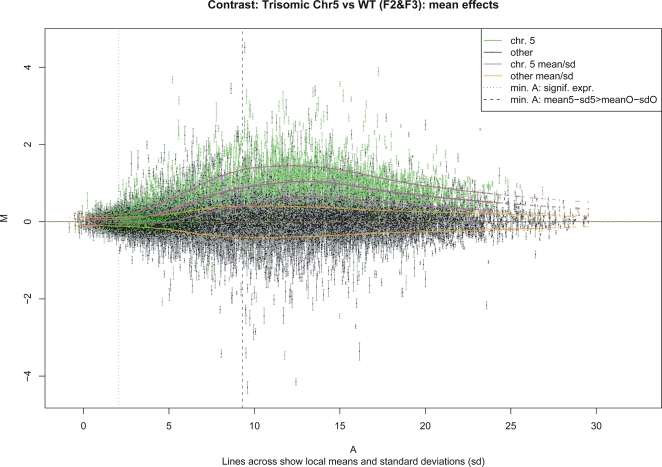
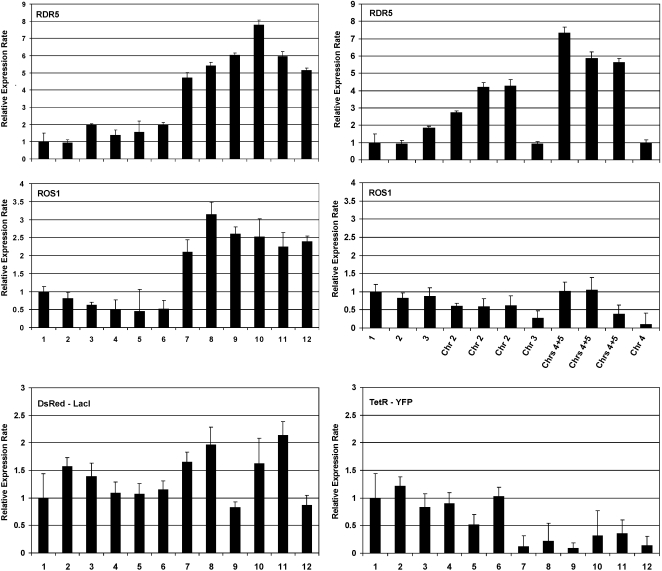
Aneuploidy refers to losses and/or gains of individual chromosomes from the normal chromosome set. The resulting gene dosage imbalance has a noticeable affect on the phenotype, as illustrated by aneuploid syndromes, including Down syndrome in humans, and by human solid tumor cells, which are highly aneuploid. Although the phenotypic manifestations of aneuploidy are usually apparent, information about the underlying alterations in structure, expression, and interphase organization of unbalanced chromosome sets is still sparse. Plants generally tolerate aneuploidy better than animals, and, through colchicine treatment and breeding strategies, it is possible to obtain inbred sibling plants with different numbers of chromosomes. This possibility, combined with the genetic and genomics tools available for Arabidopsis thaliana, provides a powerful means to assess systematically the molecular and cytological consequences of aberrant numbers of specific chromosomes. Here, we report on the generation of Arabidopsis plants in which chromosome 5 is present in triplicate. We compare the global transcript profiles of normal diploids and chromosome 5 trisomics, and assess genome integrity using array comparative genome hybridization. We use live cell imaging to determine the interphase 3D arrangement of transgene-encoded fluorescent tags on chromosome 5 in trisomic and triploid plants. The results indicate that trisomy 5 disrupts gene expression throughout the genome and supports the production and/or retention of truncated copies of chromosome 5. Although trisomy 5 does not grossly distort the interphase arrangement of fluorescent-tagged sites on chromosome 5, it may somewhat enhance associations between transgene alleles. Our analysis reveals the complex genomic changes that can occur in aneuploids and underscores the importance of using multiple experimental approaches to investigate how chromosome numerical changes condition abnormal phenotypes and progressive genome instability.


Conflict of interest statement

The authors have declared that no competing interests exist.

Figures

Figure 1
Figure 1. Experimental strategy.
We started with a normal diploid plant that was doubly homozygous for two fluorescent-tagged sites on chromosome 5: YFP (Y) on the top arm and DsRed (R) on the bottom arm (Figure 2A). Diploid seedlings (2Y 2R) were treated with colchicine to produce tetraploids (4Y 4R). Crosses between a tetraploid and diploid produced triploid progeny (3Y 3R) (F1 generation). Self-fertilization of a triploid produces a ‘swarm of aneuploids’ , including various trisomics . At the seedling stage, progeny of the triploids (F2 generation) were examined under a fluorescence microscope to determine the number of fluorescent signals in interphase nuclei of roots, which have a low background fluorescence at the excitation wavelengths for both YFP and DsRed. Three DsRed dots and three YFP dots (3R 3Y) identified seedlings that were either chromosome 5 trisomics or triploids. Optical sections were made from root nuclei in living seedlings to obtain stacks for 3D reconstructions of interphase nuclei from chromosome 5 trisomics and from triploids. Seedlings were then planted in soil and DNA and RNA were isolated from rosette leaves. DNA was used for array CGH to detect chromosome numerical imbalances and the approximate locations of chromosome breaks; RNA was used for transcript profiling. The plants were allowed to flower and metaphase chromosome counts were performed using pistil material. F3 progeny were obtained by self-fertilization of F2 plants.
Figure 2
Figure 2. Chromosomal positions of deletions and transgenes, and chromosome constitution of aneuploids.
A: Arabidopsis chromosomes showing approximate sizes in megabases (MB), positions of centromeres (white ovals), nucleolar organizers (black balls), and YFP and DsRed transgene inserts on chromosome 5, as well as the approximate chromosome breakpoints detected by array comparative genome hybridization (CGH) in the indicated chromosome 5 trisomic (6-5-22, 6-7-10 and 12-6) and triploid (11-5) plants. The positions of the breakpoints are estimated to be around the last gene that yields a trisomic signal. The breakpoint in plant 11-5 is around At1g15660 located at 5.38 MB on the top arm of chromosome 1; in plant 6-5-22 it is around At5g32440, which is in the pericentromeric heterochromatin on the bottom arm of chromosome 5; in plant 6-7-10, it is around At5g58040; and in plant 12-6 it is close to the Arabidopsis DNA and transgene DNA junction at around At5g58140. B: Array CGH identified chromosome imbalances in 33 F2 progeny obtained from self-fertilization of F1 triploids and metaphase chromosome counts determined the chromosome number (Table S1A). Trisomics (2n = 10+1) were the most common unbalanced karyotype in F2 progeny. Balanced diploids (2n = 10), triploids (3X = 15) and tetraploids (4X = 20) were also obtained. The distribution is similar to one described previously . C: Distribution of extra chromosomes in unbalanced karyotypes. All 5 Arabidopsis chromosomes were detectable as simple aneuploids (one chromosome numerically altered), while only a subset of combinations was observed in ‘extreme’ aneuploids (more than one chromosome numerically altered). Black areas in columns show the number of plants with extra chromosomes in a diploid background; white areas show the number of plants with extra chromosomes in a triploid background.
Figure 3
Figure 3. Chromosome breaks in trisomic and triploid plants.
Array CGH detected truncated copies of chromosome 5 in two chromosome 5 trisomics (6-5-22 [potentially a secondary trisomic or isochromosome (2)] and 6-7-10), and a chromosome 1 truncation in a triploid plant (11-5). Each dot represents a probe set matching a unique gene model in the Arabidopsis genome. Identical chromosome copy numbers are indicated by a log2 ratio close to 0, while trisomy is characterized by the shift above the 0 baseline. Centromeres and pericentromeric heterochromatic regions are apparent by the areas deficient in dots.
Figure 4
Figure 4. Distribution of significant expression changes across the five Arabidopsis chromosomes.
Each transcript is represented by a mark and error bar. The x-axes correspond to the gene centre locations along the chromosomes, the y-axes show expression change, with positive values indicating increased expression in the trisomic plants. Rainbow colours report on relative significance (red/yellow is highest, blue/magenta is lowest). Genes on chromosome 5 that are dosage compensated are at the zero line; any gene significantly above is not dosage compensated. Lowly expressed genes are not included in these survey plots as their expression changes are more difficult to detect accurately (see Figure 5 and text for discussion).
Figure 5
Figure 5. M(A) plot of the average expression differences M between chromosome 5 trisomic plants and disomics (y-axis) as a function of average expression A (x-axis).
Transcripts on chromosome 5 are coloured green, and the intensity dependent trend plus/minus standard deviation is plotted in magenta. The trend for transcripts on other chromosomes is shown in orange. The centre trend orange dotted line traces the x-axis, reflecting that normalized expression differences for the other chromosomes average to zero. The dotted vertical line indicates the lowest expression intensity for which a statistically significant change could be detected with p<5% (Holm FWER). The dashed vertical line marks the intensity A 1+1 where the lower magenta and the upper orange lines cross and the trends are separated by 1+1 standard deviations. The discussion of trends in the text focuses on transcripts to the right of the dashed line, where the survey will be most accurate (see Supplement for a discussion of this threshold). Normalized transformed values are shown, i.e., scales are approximately logarithmic. As has been observed before for both trisomic samples and artificial spike-in data, the non-linear nature of the measurement system does not allow a direct interpretation of the expression difference measurements shown on the y-axis as calibrated log fold-change (cf. Figure 1 in [50]).
Figure 6
Figure 6. Quantitative RT-PCR.
The relative expression levels of RDR5 and ROS1 were determined in six diploid plants (lanes 1-6; plants 6-4-2, 6-4-3, 7-2-1, 7-2-2, 7-2-3, 7-2-4) and six chromosome 5 trisomics (lanes 7–12; plants 6-5-6, 6-5-8, 6-7-19, 6-7-20, 6-7-21, 6-7-22) (left, top and middle) as well as in trisomics for other chromosomes (chr. 2, chr. 3, chr. 4) and double trisomics (chrs 4+5) (right, top and middle). The relative expression levels of the DsRed-LacI and TetR-YFP transgenes were compared in diploids (lanes 1–6) and chromosome 5 trisomics (lanes 7–12) (plant identities are the same as for RDR5 and ROS1) (bottom left and right).

References

    1. Birchler JA, Yao H, Chudalayandi S. Biological consequences of dosage dependent gene regulatory systems. Biochim Biophys Acta. 2007;1769:422–428. - PMC - PubMed
    1. Birchler JA, Veitia RA. The gene balance hypothesis: from classical genetics to modern genomics. Plant Cell. 2007;19:395–402. - PMC - PubMed
    1. Duesberg P. Chromosomal chaos and cancer. Sci Am. 2007;296:53–59. - PubMed
    1. Jones PA, Baylin SB. The fundamental role of epigenetic events in cancer. Nat Rev Genet. 2002;3:415–428. - PubMed
    1. Esteller M. Cancer epigenomics: DNA methylomes and histone-modification maps. Nat Rev Genet. 2007;8:286–298. - PubMed

Publication types