

Effects of temperature on the fluorescence intensity and anisotropy decays of staphylococcal nuclease and the less stable nuclease-conA-SG28 mutant
- PMID: 1892812
- PMCID: PMC6897575
- DOI: 10.1021/bi00101a005
Effects of temperature on the fluorescence intensity and anisotropy decays of staphylococcal nuclease and the less stable nuclease-conA-SG28 mutant
Abstract
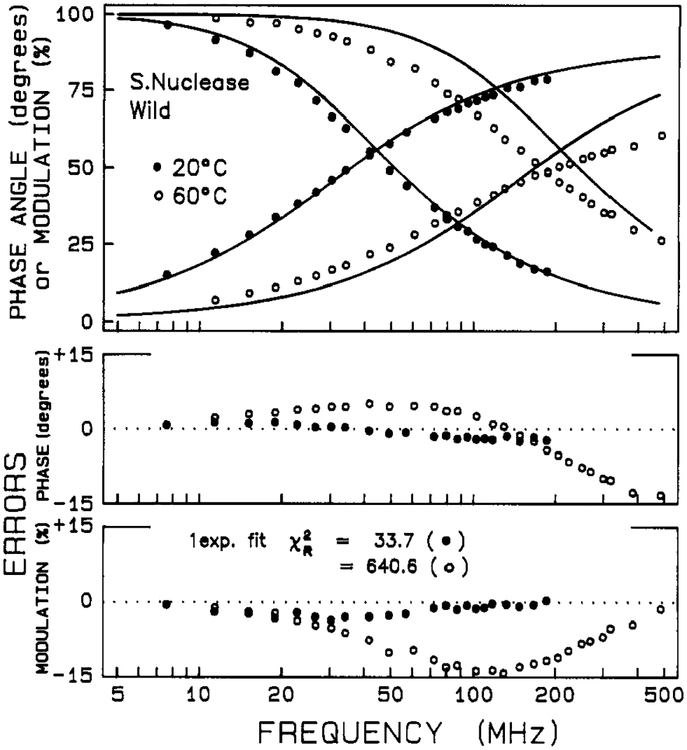
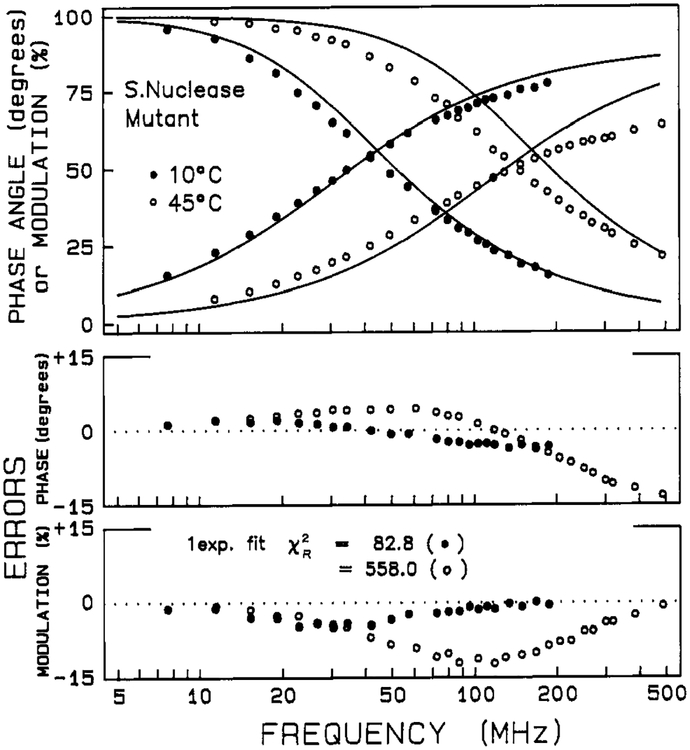
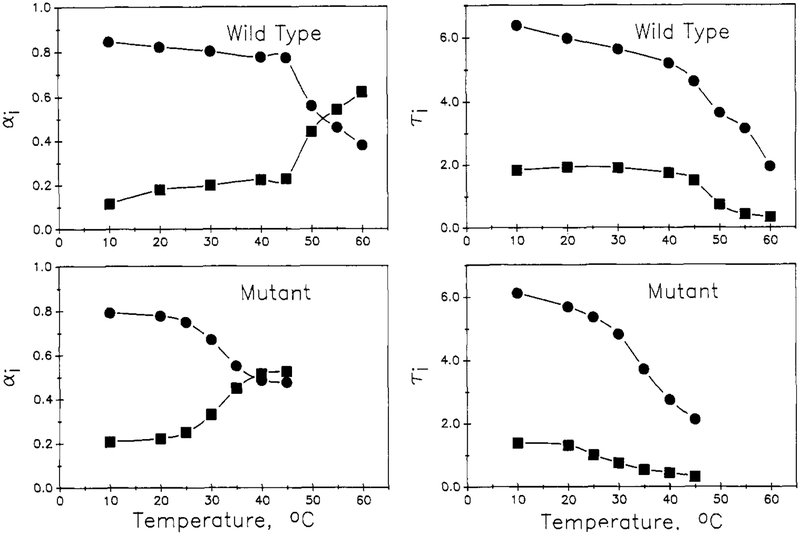
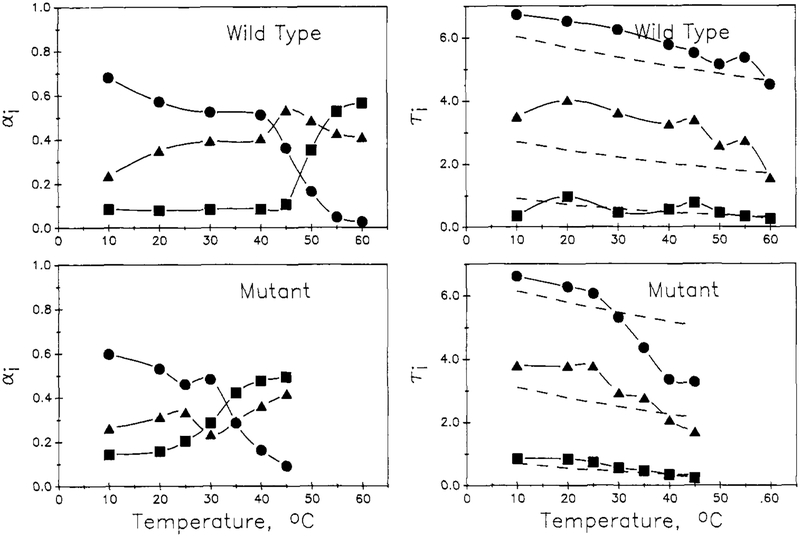
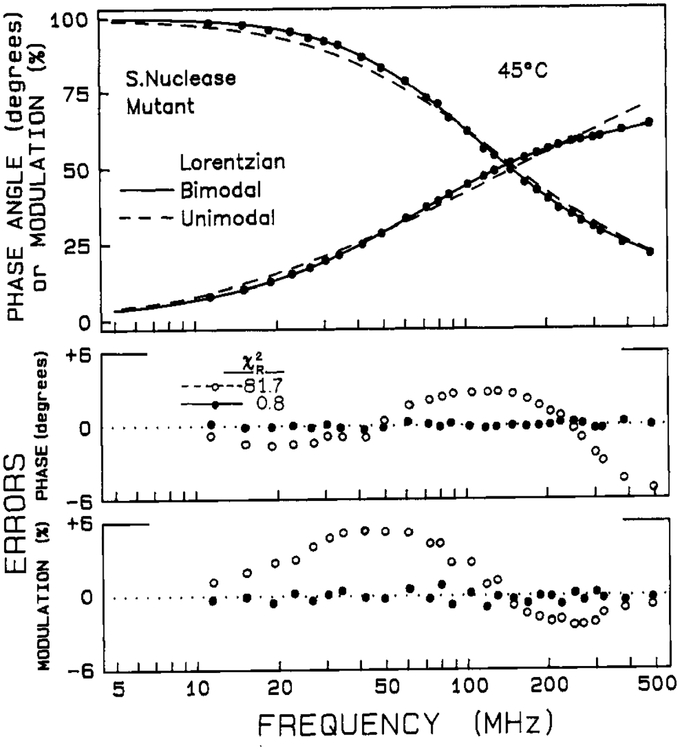
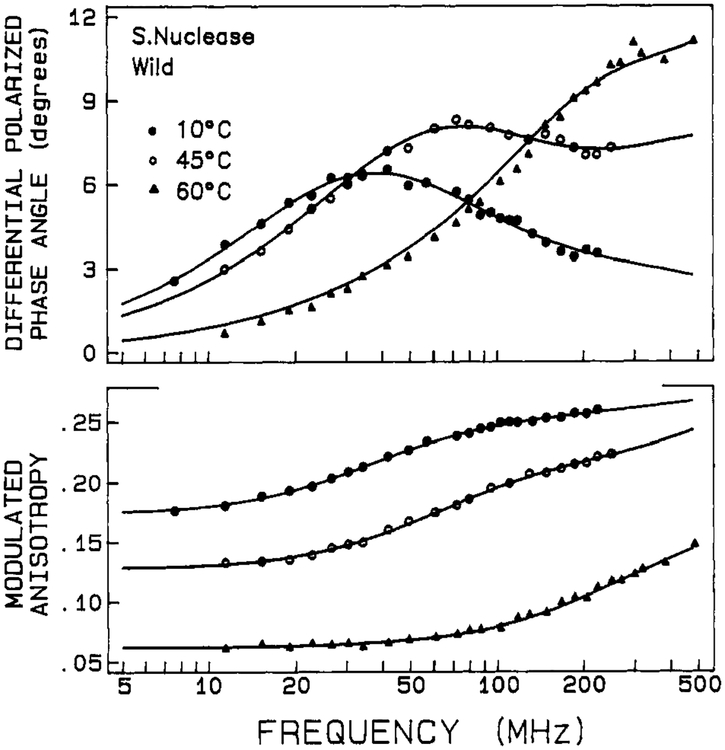
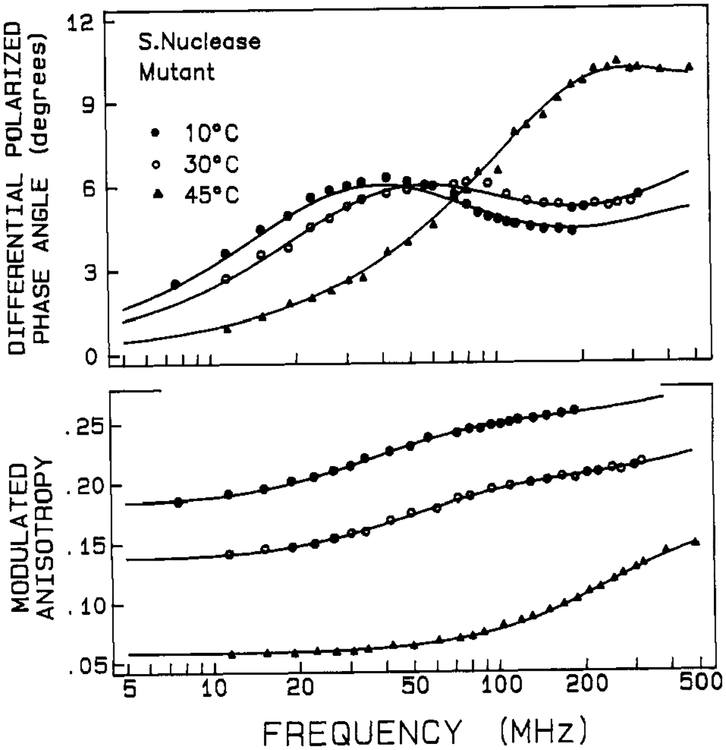
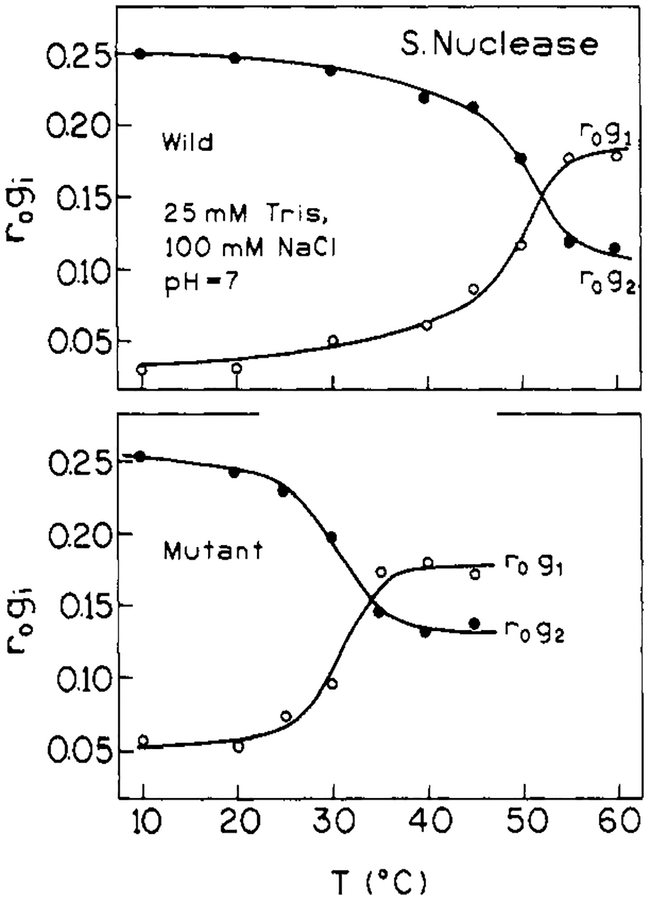
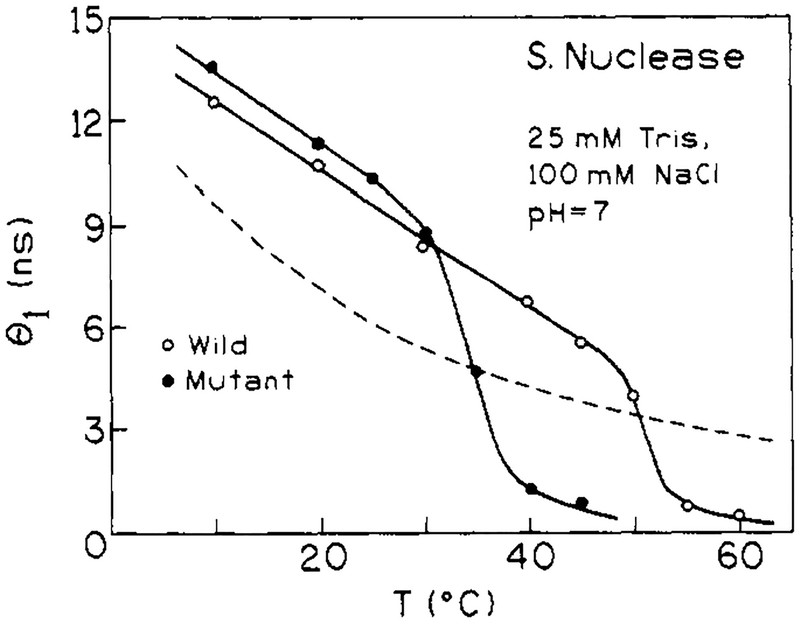
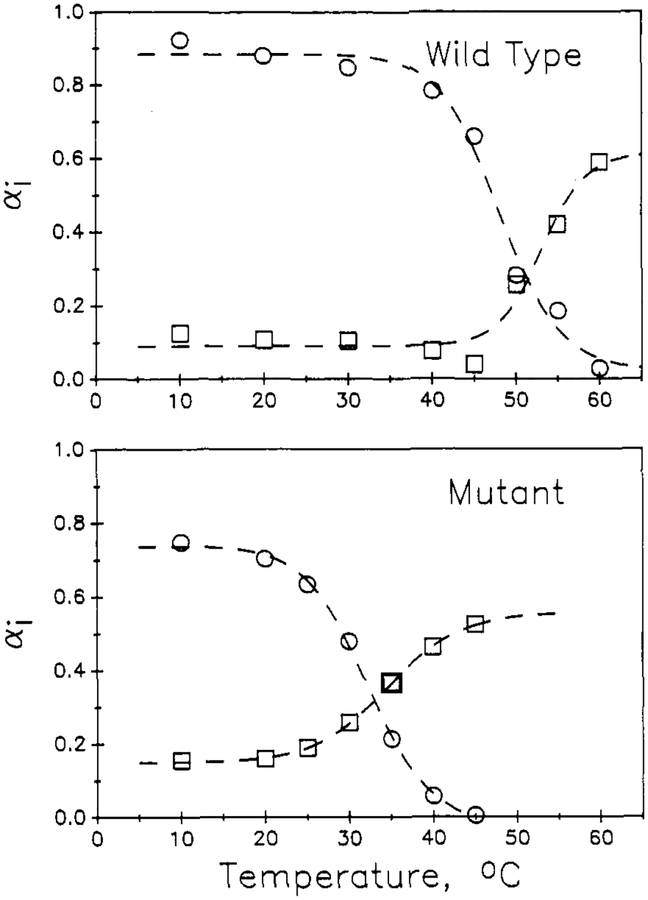
Frequency-domain fluorescence spectroscopy was used to investigate the effects of temperature on the intensity and anisotropy decays of the single tryptophan residues of Staphylococcal nuclease A and its nuclease-conA-SG28 mutant. This mutant has the beta-turn forming hexapeptide, Ser-Gly-Asn-Gly-Ser-Pro, substituted for the pentapeptide Tyr-Lys-Gly-Gln-Pro at positions 27-31. The intensity decays were analyzed in terms of a sum of exponentials and with Lorentzian distributions of decay times. The anisotropy decays were analyzed in terms of a sum of exponentials. Both the intensity and anisotropy decay parameters strongly depend on temperature near the thermal transitions of the proteins. Significant differences in the temperature stability of Staphylococcal nuclease and the mutant exist; these proteins show characteristic thermal transition temperatures (Tm) of 51 and 30 degrees C, respectively, at pH 7. The temperature dependence of the intensity decay data are shown to be consistent with a two-state unfolding model. For both proteins, the longer rotational correlation time, due to overall rotational diffusion, decreases dramatically at the transition temperature, and the amplitude of the shorter correlation time increases, indicating increased segmental motions of the single tryptophan residue. The mutant protein appears to have a slightly larger overall rotational correlation time and to show slightly more segmental motion of its Trp than is the case for the wild-type protein.
Figures
Similar articles
-
Anisotropy decays of single tryptophan proteins measured by GHz frequency-domain fluorometry with collisional quenching.Eur Biophys J. 1991;19(3):125-40. doi: 10.1007/BF00185453. Eur Biophys J. 1991. PMID: 1647947 Free PMC article.
-
Structure and dynamics of staphylococcal nuclease mutants as studied by fluorescence quenching techniques.Protein Eng. 1989 Aug;2(8):583-8. doi: 10.1093/protein/2.8.583. Protein Eng. 1989. PMID: 2682607
-
Fluorescence and conformational stability studies of Staphylococcus nuclease and its mutants, including the less stable nuclease-concanavalin A hybrids.Biochemistry. 1991 Feb 5;30(5):1193-9. doi: 10.1021/bi00219a005. Biochemistry. 1991. PMID: 1991099
-
Staphylococcal nuclease: a showcase of m-value effects.Adv Protein Chem. 1995;46:217-47. doi: 10.1016/s0065-3233(08)60336-8. Adv Protein Chem. 1995. PMID: 7771319 Review. No abstract available.
-
Thermodynamics of denaturation of staphylococcal nuclease mutants: an intermediate state in protein folding.FASEB J. 1996 Jan;10(1):67-74. doi: 10.1096/fasebj.10.1.8566550. FASEB J. 1996. PMID: 8566550 Review.
Cited by
-
The use of fluorescence methods to monitor unfolding transitions in proteins.Biophys J. 1994 Feb;66(2 Pt 1):482-501. doi: 10.1016/s0006-3495(94)80799-4. Biophys J. 1994. PMID: 8161701 Free PMC article.
-
Protein surface hydration mapped by site-specific mutations.Proc Natl Acad Sci U S A. 2006 Sep 19;103(38):13979-84. doi: 10.1073/pnas.0606235103. Epub 2006 Sep 12. Proc Natl Acad Sci U S A. 2006. PMID: 16968773 Free PMC article.
-
The substrate-binding site in the lactose permease of Escherichia coli.Proc Natl Acad Sci U S A. 1998 Aug 18;95(17):9802-7. doi: 10.1073/pnas.95.17.9802. Proc Natl Acad Sci U S A. 1998. PMID: 9707556 Free PMC article.
-
Fluorescence of native single-Trp mutants in the lactose permease from Escherichia coli: structural properties and evidence for a substrate-induced conformational change.Protein Sci. 1995 Nov;4(11):2310-8. doi: 10.1002/pro.5560041108. Protein Sci. 1995. PMID: 8563627 Free PMC article.
-
Reorientational dynamics of enzymes adsorbed on quartz: a temperature-dependent time-resolved TIRF anisotropy study.Biophys J. 2003 Apr;84(4):2533-41. doi: 10.1016/S0006-3495(03)75058-9. Biophys J. 2003. PMID: 12668461 Free PMC article.
References
-
- Antonio L, Nakano T, & Fink AL (1989) J. Cell Biol 107, abstract no. 1136.
-
- Beechem JM, & Brand L (1985) Annu. Rev. Biochem 14, 43–71. - PubMed
-
- Beechem JM, & Gratton E (1988) Time-Resolved Laser Spectroscopy in Biochemistry, Proc. SOC. Photo-Opt. Instrum. Eng 909, 70–81.
Publication types
MeSH terms
Substances
Grants and funding
LinkOut - more resources
Full Text Sources