Comparative Study
. 2008 Oct 17:9:489.
doi: 10.1186/1471-2164-9-489.

Ploidy status and copy number aberrations in primary glioblastomas defined by integrated analysis of allelic ratios, signal ratios and loss of heterozygosity using 500K SNP Mapping Arrays

Affiliations
Comparative Study

Ploidy status and copy number aberrations in primary glioblastomas defined by integrated analysis of allelic ratios, signal ratios and loss of heterozygosity using 500K SNP Mapping Arrays

Paul J Gardina et al. BMC Genomics. .

Abstract

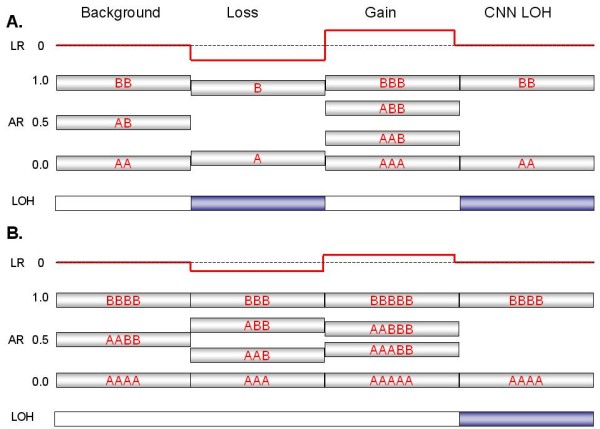
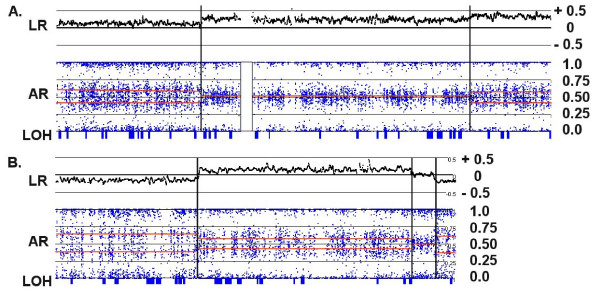
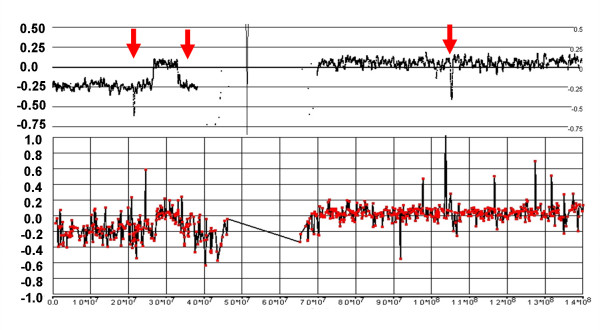
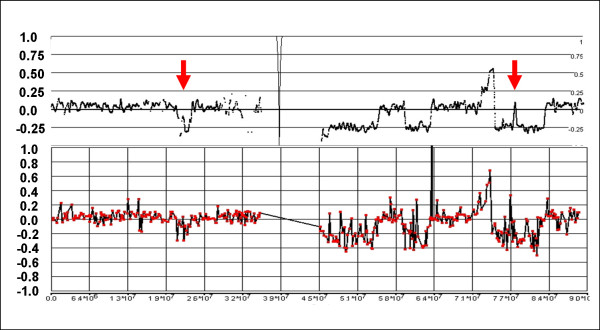
Background: Genomic hybridization platforms, including BAC-CGH and genotyping arrays, have been used to estimate chromosome copy number (CN) in tumor samples by detecting the relative strength of genomic signal. The methods rely on the assumption that the predominant chromosomal background of the samples is diploid, an assumption that is frequently incorrect for tumor samples. In addition to generally greater resolution, an advantage of genotyping arrays over CGH arrays is the ability to detect signals from individual alleles, allowing estimation of loss-of-heterozygosity (LOH) and allelic ratios to enhance the interpretation of copy number alterations. Copy number events associated with LOH potentially have the same genetic consequences as deletions.

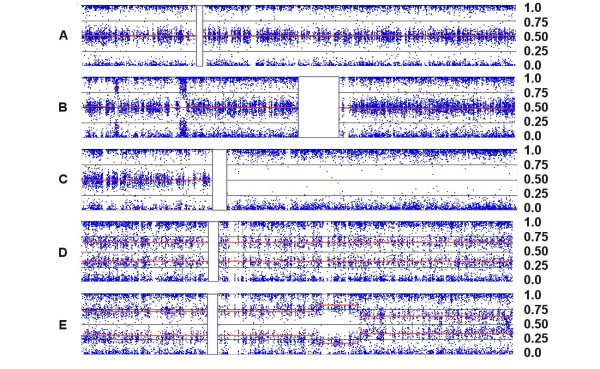
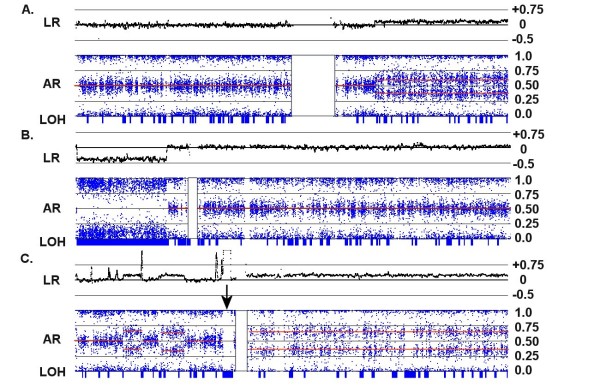
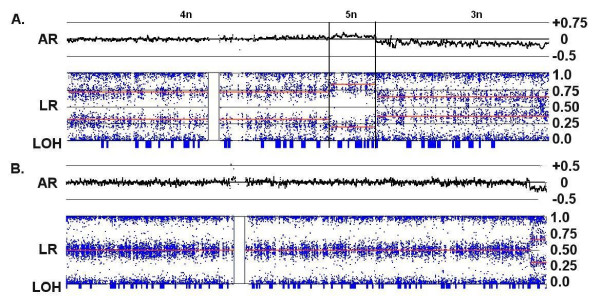
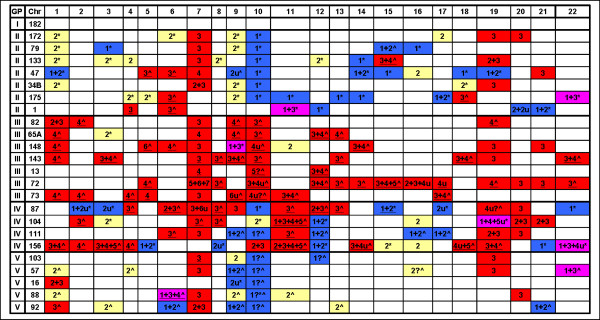
Results: We have utilized allelic ratios to detect patterns that are indicative of higher ploidy levels. An integrated analysis using allelic ratios, total signal and LOH indicates that many or most of the chromosomes from 24 glioblastoma tumors are in fact aneuploid. Some putative whole-chromosome losses actually represent trisomy, and many apparent sub-chromosomal losses are in fact relative losses against a triploid or tetraploid background.

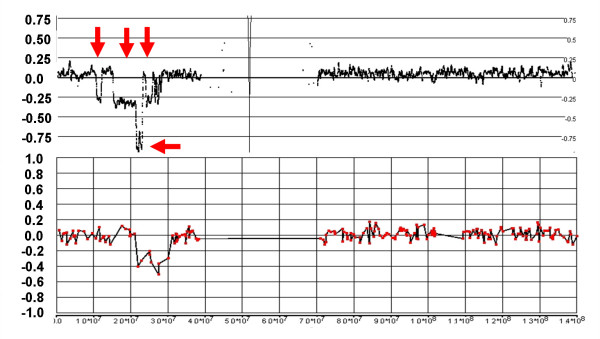
Conclusion: These results suggest a re-interpretation of previous findings based only on total signal ratios. One interesting observation is that many single or multiple-copy deletions occur at common putative tumor suppressor sites subsequent to chromosomal duplication; these losses do not necessarily result in LOH, but nonetheless occur in conspicuous patterns. The 500 K Mapping array was also capable of detecting many sub-mega base losses and gains that were overlooked by CGH-BAC arrays, and was superior to CGH-BAC arrays in resolving regions of complex CN variation.


Figures

Figure 1
Figure 1
Expected signal patterns for chromosomal changes against a background of (A) diploidy or (B) tetraploidy. The cartoon summarizes the patterns of log ratio, allelic ratio and LOH that would accompany events (a single-copy gain, a single-copy loss, or copy-neutral LOH) at four hypothetical segments of either a disomic chromosome in a diploid background (Panel A) or tetrasomic chromosome in a tetraploid background (Panel B). A log ratio (red line) of 0 indicates that copy number (CN) is unchanged relative to the baseline, which equals 2 for a normal diploid sample. The allelic ratio is the proportion of total signal generated by the B allele probe (e.g., a genotype of AAB at a particular SNP produces an allelic ratio of 0.33 [B/A+A+B]). Similar ratios from many contiguous SNPs are shown as silver boxes with red letters (various combinations of A and B) indicating the inferred genotype that is responsible for the AR value. Segments expected to produce LOH are indicated by blue boxes. Note that for a balanced tetrasomic chromosome in a tetraploid sample (Panel B), the Background state is indistinguishable from diploidy (Panel A); the LR of 0 reflects the baseline copy number of the sample, which equals 4. The two cases are only distinguishable at losses or gains, which alter the pattern in divergent ways.
Figure 2
Figure 2
Patterns of Allelic Ratios (AR). Each point (blue dot) represents the AR for one SNP mapped to its relative physical position along the length of the chromosome from the p-terminus (left) to the q-terminus (right). The vertical white rectangles indicate the position of the centromeres, which lack SNP probes. (A) In Chr:5 from sample C92, three 'bands' are evident in a disomic chromosome; ARs of 0 and 1 represent homozygous signals (AA or BB) while an AR of ~0.5 represents an equal contribution from both alleles (AB). (B) Two small deletions in the p-arm of disomic Chr:1 in C79 produce characteristic patterns that lack heterozygote signal and show some bleeding of the single-copy homozygotic signal (one A or B allele) toward the middle. (C) The copy-number neutral LOH seen on the long arm of Chr:8 in C156 also lacks heterozygous signal, but does not show inward bleeding. (D) A trisomic pattern for Chr:10 in C82 is characterized by heterozygotic ratios near 0.33 (AAB) and 0.67 (ABB), rather than at 0.5. (E) An unbalanced tetrasomy pattern for Chr:10 in C72, reflecting heterozygote ratios of 0.25 (AAAB) and 0.75 (ABBB), is seen on the short arm, but the ARs shift to an unbalanced pentasomic (ABBBB) and then a trisomic pattern (ABB) near the mid-point of the long arm.
Figure 3
Figure 3
Copy number changes in a diploid background. Each panel shows an integrated view of log ratios (LR), allelic ratios (AR) and LOH. (A) A single copy gain in the q-arm of the disomic Chr:1 in C82 is detected by a 0.25 increase in the log ratio and a shift in the AR to a trisomy pattern (i.e., from 0.5 to 0.33 and 0.67). (B) A single copy loss in the p-arm of Chr:5 in C156 is detected by a -0.4 decrease in the log ratio and a shift in the AR to a monosomic pattern. The loss is accompanied by a collinear region of LOH (indicated by the long blue rectangle on the LOH bar). (C) A complex series of CNAs on Chr:7 in C92 is paralleled by changes in the ARs. Note that the entire q-arm is trisomic, and the strong amplification event on the p-arm adjacent to the centromere (indicated by an arrow) shifts the AR to extreme values and generates a collinear segment of LOH.
Figure 4
Figure 4
Copy number changes in an apparent tetraploid background. (A) Allelic ratios of 0.25 and 0.75 for Chr:10 in C72 indicate an unbalanced tetrasomy (labeled as "4n") for the p-arm of this chromosome, even though the log ratio is 0 and the putative copy number is 2. A decrease in the LR suggests a loss of chromosomal material in the q-arm ("3n"), but the region produces an AR pattern characteristic for trisomy with no collinear LOH. The center of the q-arm also displays a short segment of unbalanced pentasomy ("5n") accompanied by a small increase in the LR and allelic ratios consistent with ABBBB and AAAAB allele patterns. (B) Chromosome 2 in C82 exhibits a LR with an apparent CN of 2 and an AR consistent with normal disomy. However, the small deletion at the q-terminus produces a trisomic pattern and no LOH, revealing that the majority of the chromosome is actually a balanced tetrasomy (AABB). For both examples, the overall indication is that the baseline CN of the chromosome is 4 copies rather than 2, and both samples are largely tetraploid.
Figure 5
Figure 5
Chromosomal CNAs demonstrating high polysomies. (A) For chromosome 7 in C72, the LR and AR patterns are consistent with segments of CN = 5 (AAABB), 6 (AAABBB) and 7 (AAAABBB) from left to right (as partitioned by the vertical lines). The corresponding log ratios are 0.15, 0.25 and 0.35, respectively. (B) For Chr:15 in C72, the AR patterns are consistent with segments of CN = 3 (AAB), 5 (AAABB), 4 (AABB) and 3 (AAB) from left to right. The corresponding log ratios are -0.2, +0.2, 0 and -0.2, respectively. Thus, the "copy neutral" LR of 0 actually represents a CN of 4.
Figure 6
Figure 6
Relative magnitude of LR changes in diploid and tetraploid backgrounds. The lighter signal trace represents loss of the entire chromosome 10 in C172 where an LR of 0 corresponds to a CN of 2. In this case, a CN loss of 1 produces a LR of -0.4. In C72 where the background is largely tetraploid (the dark signal trace), a single copy loss (i.e., from CN of 4 to CN of 3) in the q-arm of chromosome 10 results in a decrease of the LR to only -0.15.
Figure 7
Figure 7
Predominant baseline CN for assigned chromosomes of 24 tumor samples. Codes: yellow = diploid; red = CN gain; blue = CN loss; pink = mixed gains and losses; u = unbalanced; * = LOH detected for losses; ^ = LOH not detected for losses; underline = CN under estimated by LR; ? = ambiguous AR pattern.
Figure 8
Figure 8
Complex losses and gains in the q-arm of Chr:16 of sample C111. The figure shows the LR from the 500 K (top) and 19 K BAC (bottom) arrays with the genomic scale (x-axis) indicating the SNP position or the center point of the BAC clone. The status of the CN changes is more clearly resolved with the 500 K arrays than with the BAC array, particularly for two sizeable regions of loss (between 45 Mb-54 Mb and 59 Mb – 63 Mb). Furthermore, CGH does not clearly detect a loss at 20.88 – 23.36 Mb and a copy neutral region within a deletion at 77.14 – 77.54 Mb (arrows).
Figure 9
Figure 9
Complex losses in the p-arm of Chr:9 of sample C79. The 500 K array generates a detailed fine mapping of this region compared with the grosser image from the 6 K BAC array. In particular, the BAC array misses losses at 10.32 – 11.83 Mb and 14.94 – 21.07 Mb, as well as a copy neutral region from 22.90–23.76 Mb (vertical arrows). Furthermore, the 500 K mapping clearly delineates a region of homozygous deletion from 21.07 – 22.90 that is not apparent on the BAC array (horizontal arrow).
Figure 10
Figure 10
Discrepancies between 500 K and 19 K BAC arrays for Chr:9 of sample C111. A 5 Mb loss at 33.65 – 38.70 Mb, and two small homozygous deletions at 21.86 – 22.21 Mb and 103.42 – 103.85 Mb are apparent in the 500 K mapping, but not definitively detected by CGH.

References

    1. Cavenee WK, Dryja TP, Phillips RA, Benedict WF, Godbout R, Gallie BL, Murphree AL, Strong LC, White RL. Expression of recessive alleles by chromosomal mechanisms in retinoblastoma. Nature. 1983;305:779–784. - PubMed
    1. Lo KC, Rossi MR, LaDuca J, Hicks DG, Turpaz Y, Hawthorn L, Cowell JK. Candidate glioblastoma development gene identification using concordance between copy number abnormalities and gene expression level changes. Genes Chromosomes Cancer. 2007;46:875–894. - PubMed
    1. Lo KC, Rossi MR, Burkhardt T, Pomeroy SL, Cowell JK. Overlay analysis of the oligonucleotide array gene expression profiles and copy number abnormalities as determined by array comparative genomic hybridization in medulloblastomas. Genes Chromosomes Cancer. 2007;46:53–66. - PubMed
    1. Cowell JK, Nowak NJ. High-resolution analysis of genetic events in cancer cells using bacterial artificial chromosome arrays and comparative genome hybridization. Adv Cancer Res. 2003;90:91–125. - PubMed
    1. Pinkel D, Albertson DG. Comparative genomic hybridization. Annu Rev Genomics Hum Genet. 2005;6:331–354. - PubMed

Publication types

LinkOut - more resources