Comparative Study
. 2008 Oct 14;52(16):1314-25.
doi: 10.1016/j.jacc.2008.07.019.

Osteocalcin expression by circulating endothelial progenitor cells in patients with coronary atherosclerosis

Affiliations
Comparative Study

Osteocalcin expression by circulating endothelial progenitor cells in patients with coronary atherosclerosis

Mario Gössl et al. J Am Coll Cardiol. .

Abstract

Objectives: This study was designed to test whether patients with coronary atherosclerosis have increases in circulating endothelial progenitor cells (EPCs) expressing an osteogenic phenotype.

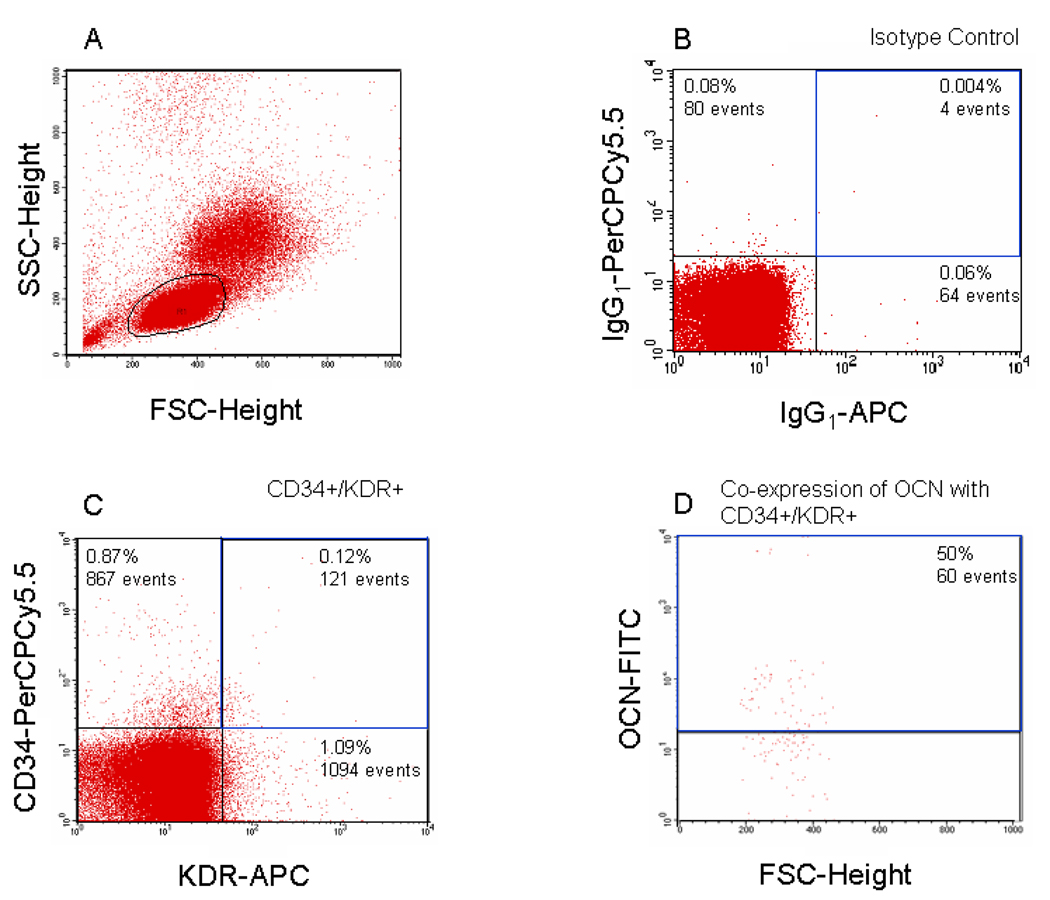
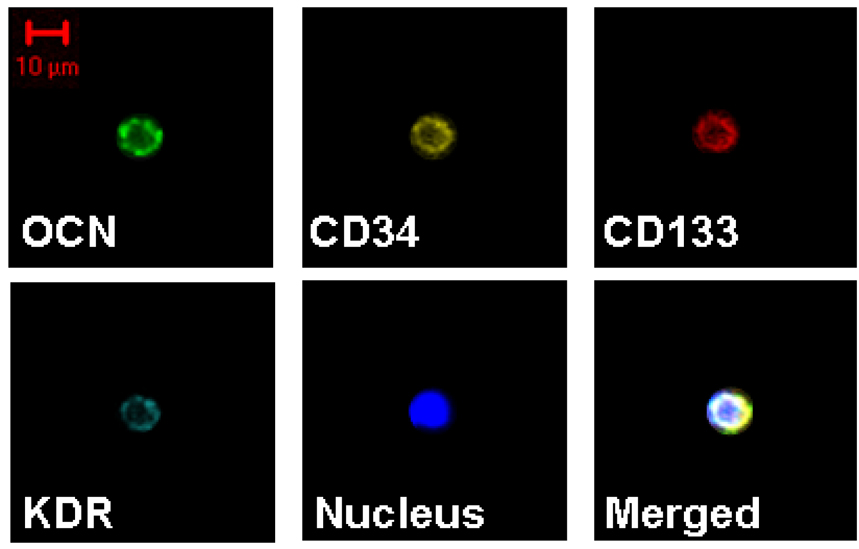
Background: Increasing evidence indicates a link between bone and the vasculature, and bone marrow and circulating osteogenic cells have been identified by staining for the osteoblastic marker, osteocalcin (OCN). Endothelial progenitor cells contribute to vascular repair, but repair of vascular injury may result in calcification. Using cell surface markers (CD34, CD133, kinase insert domain receptor [KDR]) to identify EPCs, we examined whether patients with coronary atherosclerosis had increases in the percentage of EPCs expressing OCN.

Methods: We studied 72 patients undergoing invasive coronary assessment: control patients (normal coronary arteries and no endothelial dysfunction, n = 21) versus 2 groups with coronary atherosclerosis-early coronary atherosclerosis (normal coronary arteries but with endothelial dysfunction, n = 22) and late coronary atherosclerosis (severe, multivessel coronary artery disease, n = 29). Peripheral blood mononuclear cells were analyzed using flow cytometry.

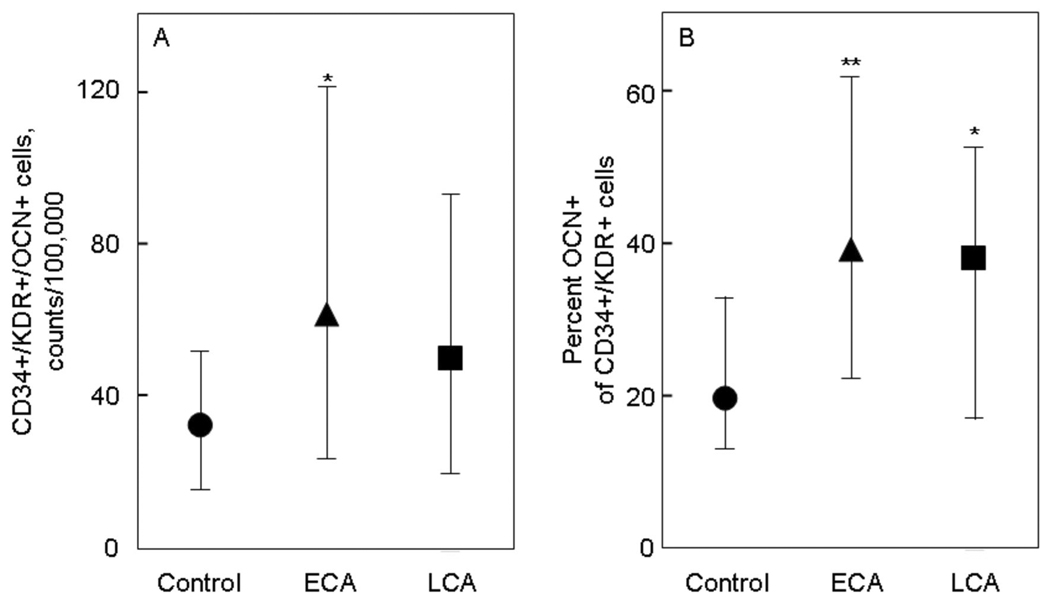
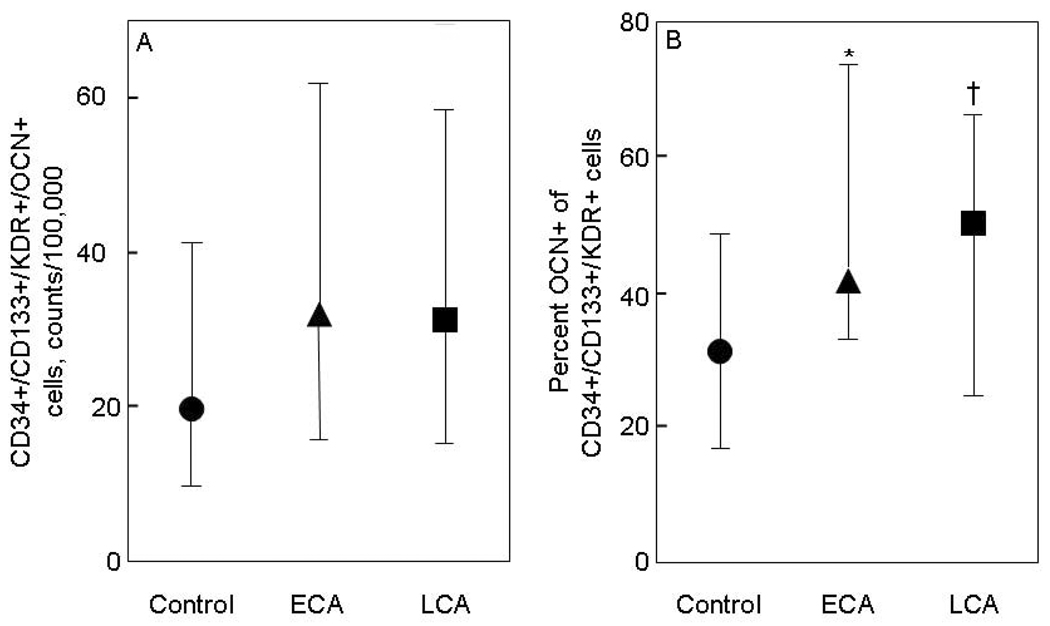
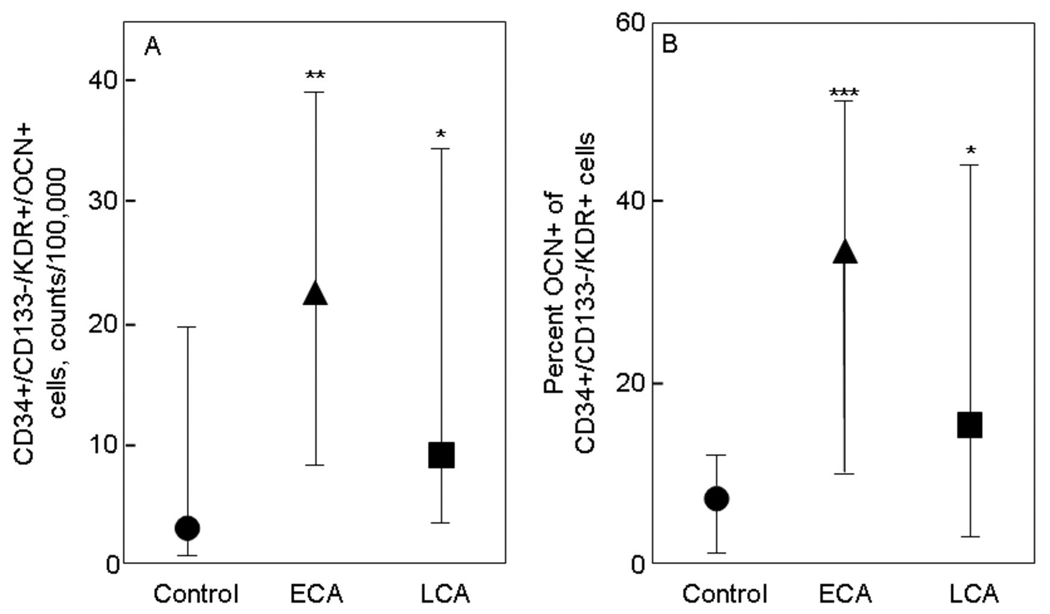
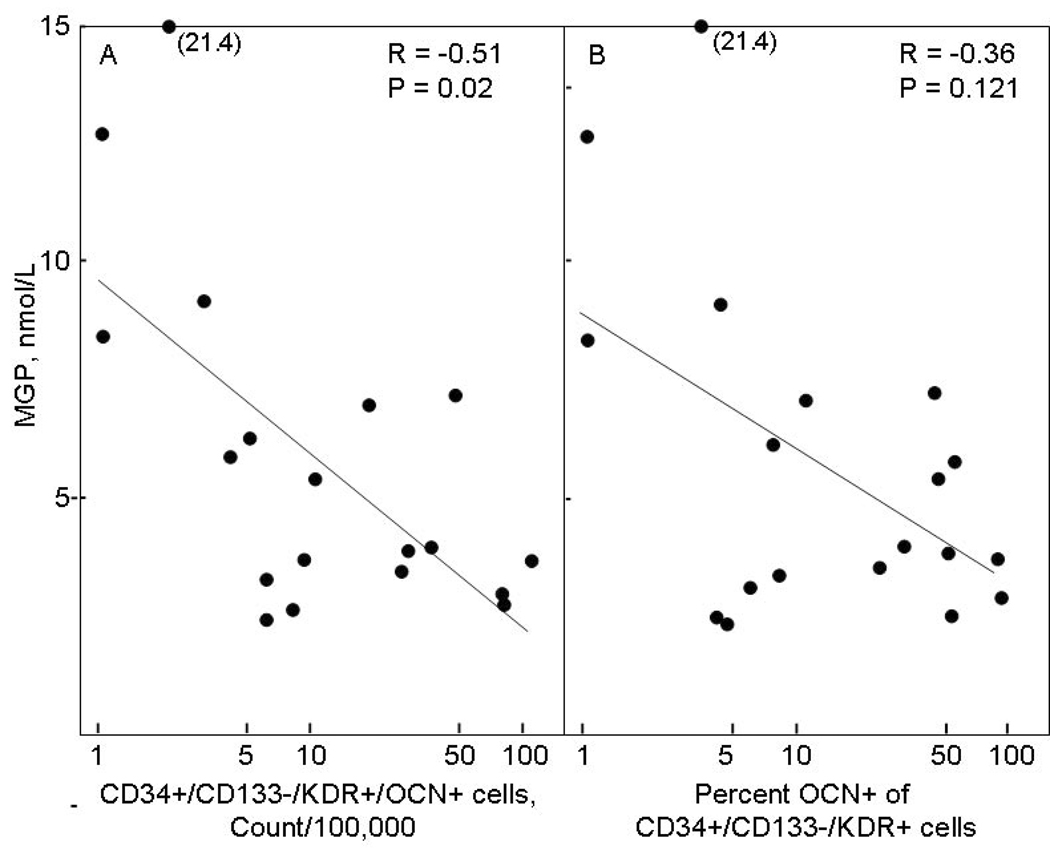
Results: Compared with control patients, patients with early or late coronary atherosclerosis had significant increases (approximately 2-fold) in the percentage of CD34+/KDR+ and CD34+/CD133+/KDR+ cells costaining for OCN. Even larger increases were noted in the early and late coronary atherosclerosis patients in the percentage of CD34+/CD133-/KDR+ cells costaining for OCN (5- and 2-fold, p < 0.001 and 0.05, respectively).

Conclusions: A higher percentage of EPCs express OCN in patients with coronary atherosclerosis compared with subjects with normal endothelial function and no structural coronary artery disease. These findings have potential implications for the mechanisms of vascular calcification and for the development of novel markers for coronary atherosclerosis.


Conflict of interest statement

The authors have no conflicts of interest.

Figures

Figure 1
Figure 1. Example of flow analysis
Panel A shows the forward/side scatter and the gates used in the analysis. Panel B shows the staining with the isotype controls for the CD34- and KDR-specific antibodies and panel C shows the specific staining with these antibodies. Panel D shows the CD34/KDR+ cells stained with the OCN antibody. We required that < 0.5% of the cells were positive with the isotype controls, and for all data reported in the paper, we subtracted the signal of the isotype from the signal due to the specific antibodies.
Figure 2
Figure 2. OCN co-staining of CD34+/KDR+ cells
(A) CD34+/KDR+/OCN+ cells, expressed as absolute counts per 100,000 counts, and (B) percent OCN+ of CD34+/KDR+ cells in control subjects (circles), patients with early coronary atherosclerosis (ECA, triangles), and in patients late coronary atherosclerosis (LCA, squares). *P < 0.05 and **P < 0.01 compared with control subjects. Shown are the median values and IQRs.
Figure 3
Figure 3. OCN co-staining of CD34+/CD133+/KDR+ cells
(A) CD34+/CD133+/KDR+/OCN+ cells, expressed as absolute counts per 100,000 counts, and (B) percent OCN+ of CD34+/CD133+/KDR+ cells in control subjects (circles), patients with early coronary atherosclerosis (ECA, triangles), and in patients late coronary atherosclerosis (LCA, squares). *P < 0.05, **P < 0.01, and †P = 0.071 compared with control subjects. Shown are the median values and IQRs.
Figure 4
Figure 4. OCN co-staining of CD34+/CD133−/KDR+ cells
(A) CD34+/CD133−/KDR+/OCN+ cells, expressed as absolute counts per 100,000 counts, and (B) percent OCN+ of CD34+/CD133−/KDR+ cells in control subjects (circles), patients with early coronary atherosclerosis (ECA, triangles), and in patients late coronary atherosclerosis (LCA, squares). *P < 0.05 and ***P < 0.001 compared with control subjects. Shown are the median values and IQRs.
Figure 5
Figure 5. Correlation with serum MGP levels
Correlation between serum MGP levels in the LCA patients and (A) CD34+/CD133−/KDR+/OCN+ cells, expressed as absolute counts per 100,000 counts, and (B) percent OCN+ of CD34+/CD133−/KDR+ cells.
Figure 6
Figure 6. Confocal microscopy of cells
Confocal microscopy showing a cell staining with all four antibodies used in the study (OCN, CD34, CD133, KDR). Shown also is a stain for nuclei (DAPI) and the merged images.
Figure 7
Figure 7. Mineralization assays
In vitro mineralization assay of CD34+ cells from an anonymous blood donor (A) using von Kossa staining and (B) using Alizarin Red staining and (C) of PBMNCs from a patient with LCA (Alizarin Red stain). In these cultures, cells were exposed to Ca2+ for 5 days followed by 21 days of culture in osteoblast differentiation medium. All pictures are at x 4 magnification.
Figure 8
Figure 8. Gene expression data
Gene expression analysis of CD34+ cells from 6 anonymous blood donors. (A) Expression of bone-related and other genes normalized to undifferentiated hMSCs (expression of each gene in hMSCs set at 1.0); (B) Changes in expression of mRNAs for CD34 and CD45 following in vitro culture; (C) Changes in expression of mRNAs for osteopontin and Col1α1 following in vitro culture; and (D) Changes in mRNA expression for Col1α1 following in vitro culture in the 3 samples with the highest versus the lowest expression of OCN mRNA prior to culture. *P < 0.05, **P < 0.01 and ***P < 0.001 compared to 1.0 using a one-sample t-test; †P < 0.01 and ††P < 0.001 compared to freshly sorted CD34 cells using a two-sample t-test. N.D., not detected.

References

    1. Tanko LB, Christiansen C, Cox CA, Geiger MJ, McNabb MA, Cummings SR. Relationship between osteoporosis and cardiovascular disease in postmenopausal women. J Bone Miner Res. 2005;20:1912–1920. - PubMed
    1. Sambrook PN, Chen CJS, March LM, et al. High bone turnover is an independent predictor of mortality in the frail elderly. J Bone Miner Res. 2006;21:549–555. - PubMed
    1. Bucay N, Sarosi I, Dunstan CR, et al. Osteoprotegerin-deficient mice develop early onset osteoporosis and arterial calcification. Genes Dev. 1998;12:1260–1268. - PMC - PubMed
    1. Johnson RC, Leopold JA, Loscalzo J. Vascular calcification: pathobiological mechanisms and clinical implications. Circ Res. 2006;99:1044–1059. - PubMed
    1. Rajamannan NM, Bonrow RO, Rahimtoola SH. Calcific aortic stenosis: an update. Nat Clin Pract Cardiovasc Med. 2007;4:254–262. - PubMed

Publication types

MeSH terms