Review
. 2008 Nov;46(3):204-12.
doi: 10.1016/j.ymeth.2008.09.009. Epub 2008 Oct 16.

Methods for studying store-operated calcium entry

Affiliations
Review

Methods for studying store-operated calcium entry

Gary S Bird et al. Methods. 2008 Nov.

Abstract

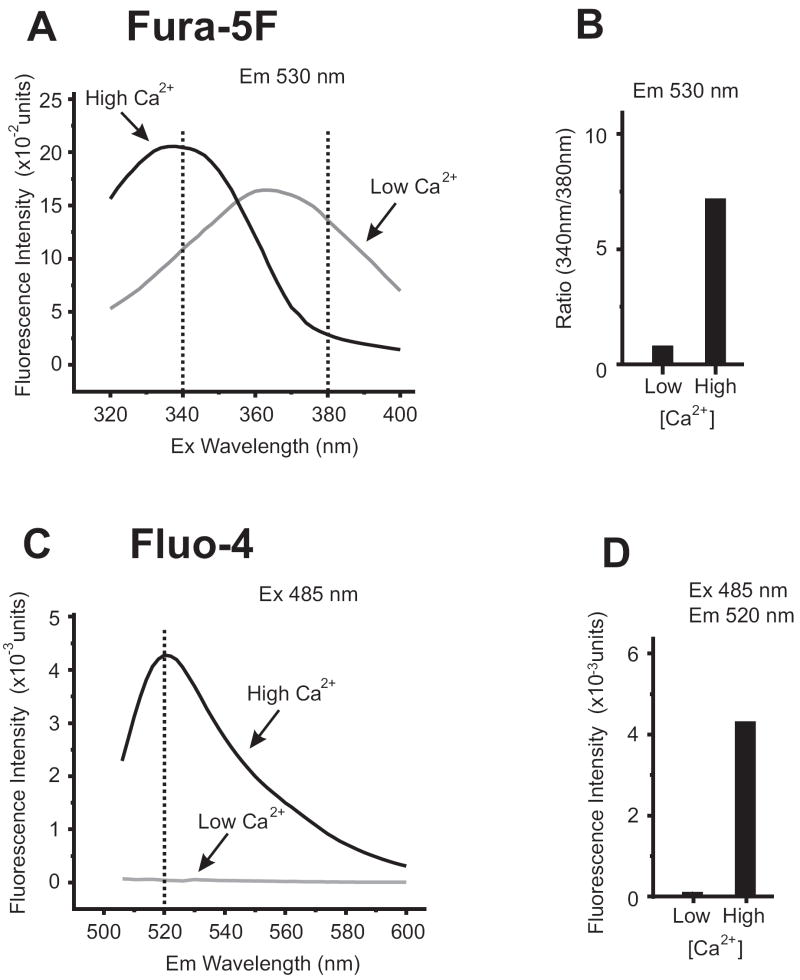
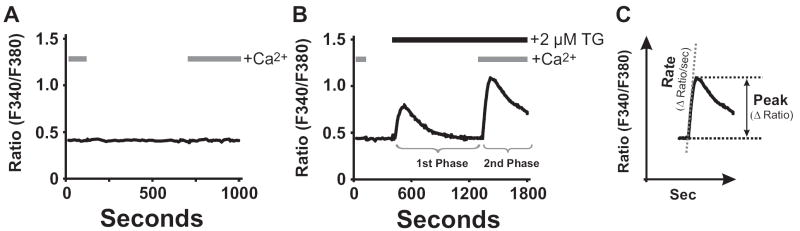
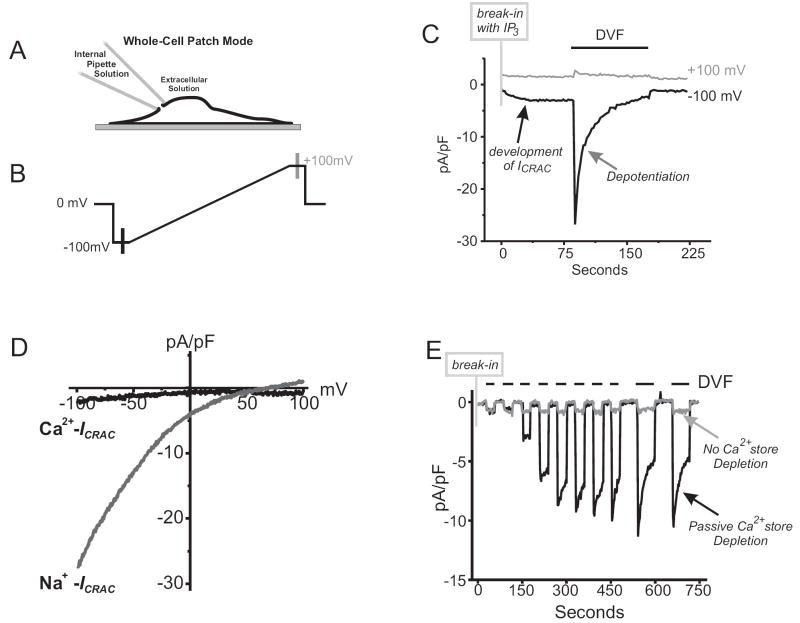
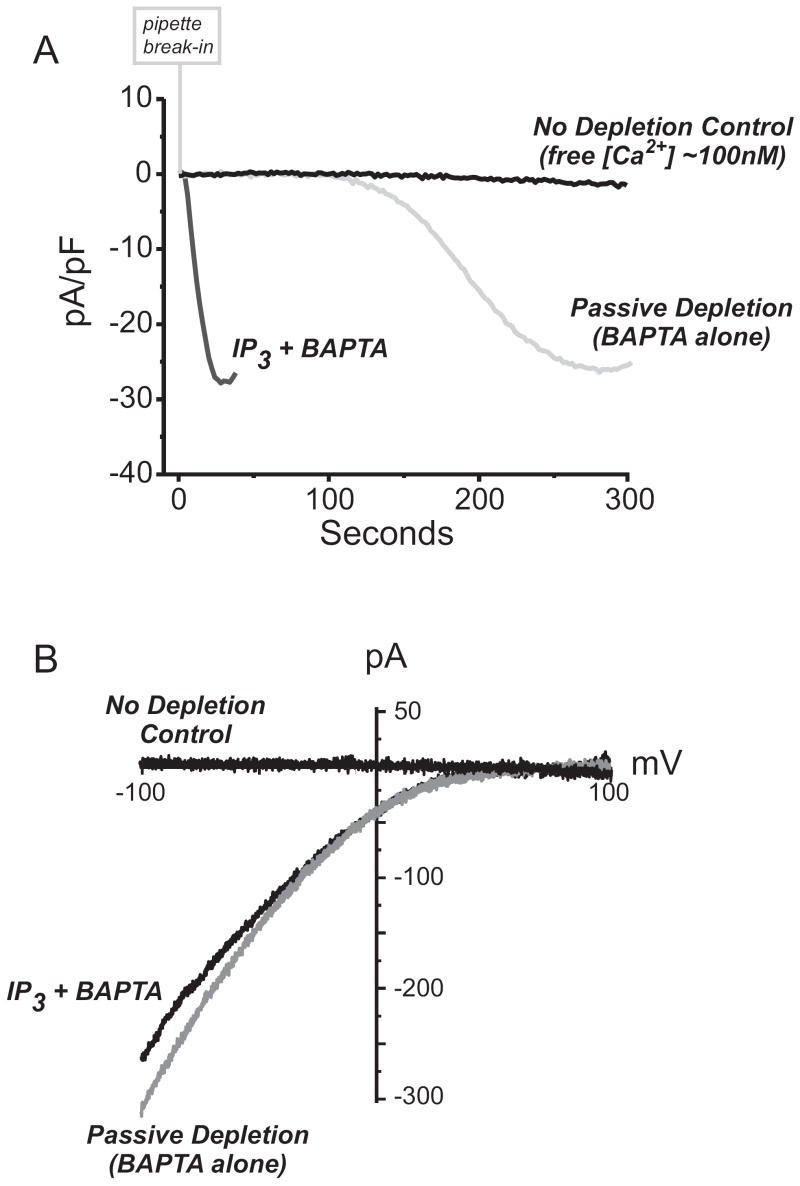
Activation of surface membrane receptors coupled to phospholipase C results in the generation of cytoplasmic Ca2+ signals comprised of both intracellular Ca2+ release, and enhanced entry of Ca2+ across the plasma membrane. A primary mechanism for this Ca2+ entry process is attributed to store-operated Ca2+ entry, a process that is activated by depletion of Ca2+ ions from an intracellular store by inositol 1,4,5-trisphosphate. Our understanding of the mechanisms underlying both Ca2+ release and store-operated Ca2+ entry have evolved from experimental approaches that include the use of fluorescent Ca2+ indicators and electrophysiological techniques. Pharmacological manipulation of this Ca2+ signaling process has been somewhat limited; but recent identification of key molecular players, STIM and Orai family proteins, has provided new approaches. Here we describe practical methods involving fluorescent Ca2+ indicators and electrophysiological approaches for dissecting the observed intracellular Ca2+ signal to reveal characteristics of store-operated Ca2+ entry, highlighting the advantages, and limitations, of these approaches.


Figures

Figure. 1
Figure. 1. Spectral Characteristic of Ratiometric and Single Wavelength Ca2+Indicators
(A) Emission spectra of fura-5F (free-acid form) recorded at 530nm while scanning excitation wavelengths from 320-400nm. With 10 μM fura-5F dissolved in buffer containing 100 mM KCl, 20 mM HEPES, pH 7.2, switching between ‘low Ca2+‘ (buffer +200 μM BAPTA) and ‘high Ca2+’ (buffer + 1 mM CaCl2) conditions demonstrates the spectral shift characteristics of fura-5F. This [Ca2+] change can be quantified by ratioing the emission fluorescence measured at 340nm and 380nm excitation wavelengths, as shown in (B). (C) Spectra for fluo-4 (free-acid form) was recorded with excitation at 485nm while scanning emission wavelengths from 500-600nm. Using the same buffers as in (A), switching between ‘low Ca2+‘(buffer +200 μM BAPTA) and ‘high Ca2+’ (buffer + 1 mM CaCl2) demonstrates the fluorescence intensity change in the spectra. This [Ca2+] change can be quantified by selecting a single emission wavelength at which the intensity change is maximal, as shown in (D) (measured at 520nm).
Figure. 2
Figure. 2. ‘Ca2+re-addition’ Protocol and Biphasic Ca2+Signaling
HEK 293 cells were loaded with fura-5F and intracellular [Ca2+]i measured as described in [57]. In (A) and (B), HEK 293 cells were subjected to the ‘Ca2+ re-addition’ protocol by switching between buffer solutions with extracellular Ca2+ present or absent. In unstimulated HEK 293 cells (A), the ‘Ca2+ re-addition’ protocol elicits no detectable change in [Ca2+]i. In (B), the ‘Ca2+ re-addition’ protocol was combined with treatment of cells with a SERCA pump inhibitor (2 μM thapsigargin) to demonstrate a biphasic Ca2+ response. In the absence of extracellular [Ca2+], the transient first phase of intracellular Ca2+ release is observed. On ‘Ca2+ re-addition’, the seconds phase of SOCE is observed. As shown in (C), the extent of SOCE activity can be quantified either as a rate of Ca2+ entry, or appeal response.
Figure 3
Figure 3. Biophysical Assessment of Store-Operated Currents
(A) Diagram showing the whole-cell configuration of the patch-clamp technique. As depicted, the use of this technique allows for access to the inside of the cell through the internal pipette solution (See Table 3 for example solutions), allowing for depletion of internal Ca2+ stores passively with BAPTA alone, or in combination with activating reagents such as IP3. (B) Schematic of a voltage ramp protocol used to assess store-operated Ca2+ currents. The protocol is repetitively applied over time, with 1 to 2 second intervals at 0 mV, to reveal currents develop during Ca2+ store depletion. (C) An example ICRAC in an RBL cell recorded using the protocol shown in panel B, and which was repetitively applied every two seconds. Internal Ca2+ stores were actively depleted by including 20 μM IP3 and 10 mM BAPTA in the patch pipette solution. 10 mM Ca2+ was present in the external bathing solution. Following break-in with the patch pipette, a small (2 pA/pF) inward current develops at -100 mV, while no change is observed at +100 mV). Upon removal of all external divalent cations (divalent-free, DVF) in the extracellular media, Na+ ions now permeate the store-operated channel to reveal Na+-ICRAC. Over time, Na+-ICRAC depotentiates, a process which is the reciprocal of a process known as Ca2+ dependent potentiation (CDP). (D) Current-voltage relationship of Ca2+-ICRAC and Na+-ICRAC are inwardly rectifying Ca2+- and Na+-ICRAC (data taken from recordings shown in panel C). (E) In this whole-cell recording, DVF conditions were used to reveal ICRAC in HEK 293 cells where, normally, Ca2+- ICRAC is difficult to detect. Following break-in, the protocol entails switching the external bathing solutions between Ca2+ containing (10mM) and DVF bathing solutions. Using optimal conditions for passive depletion of Ca2+ stores (10 mM BAPTA in patch pipette solution), no ICRAC is observed with 10mM Ca2+ in the external bathing solution. By switching to DVF conditions the developing Na+-ICRAC is revealed (black line trace). In contrast, supplementing the internal pipette solution with enough Ca2+ to “clamp” free Ca2+ at 100 nM (calculated using Maxchelator software; www.stanford.edu/~cpatton/maxc) prevents the passive depletion of Ca2+ stores upon break in, and no ICRAC current develops (grey line trace) under all external bathing solution conditions.
Figure 4
Figure 4. Methods for activating ICRAC
(A) Whole –cell currents recorded in HEK 293 cells transfected with Stim1 and Orai1. From a holding potential of 0 mV, developing store-operated currents were recorded during voltage ramps (-100 mV to +100 mV) applied every two seconds using. This data shows a time course of Ca2+-ICRAC development recorded -100 mV. With coexpression of Stim1 and Orai1, “monster” Ca2+-ICRAC currents develop, and without the need to use DVF conditions. In this experiments, we compare the time course of Ca2+-ICRAC activation when Ca2+ stores are depleted passively (20mM BAPTA alone in the internal pipette solution) or actively (20mM BAPTA plus 20 μM IP3 in the pipette). In contrast, “clamping” free [Ca2+] in the internal pipette solution to ~100 nM prevents Ca2+ store depletion, and no “monster” Ca2+-ICRAC is observed. In all recordings, the external [Ca2+] was 10 mM. (B) Current-voltage relationships for each of the “monster” Ca2+-ICRAC currents recorded in panel A are inwardly rectifying akin to endogenous ICRAC.

References

    1. Putney JW, Poggioli J, Weiss SJ. Phil Trans R Soc Lond B. 1981;296:37–45. - PubMed
    1. Berridge MJ, Irvine RF. Nature. 1984;312:315–321. - PubMed
    1. Berridge MJ. Ann Rev Biochem. 1987;56:159–193. - PubMed
    1. Parekh AB, Putney JW. Physiol Rev. 2005;85:757–810. - PubMed
    1. Cahalan MD, Zhang SL, Yeromin AV, Ohlsen K, Roos J, Stauderman KA. Cell Calcium. 2007;42:133–144. - PMC - PubMed

MeSH terms