

Mitochondrial function in vivo: spectroscopy provides window on cellular energetics
- PMID: 18930151
- PMCID: PMC10798296
- DOI: 10.1016/j.ymeth.2008.10.001
Mitochondrial function in vivo: spectroscopy provides window on cellular energetics
Abstract
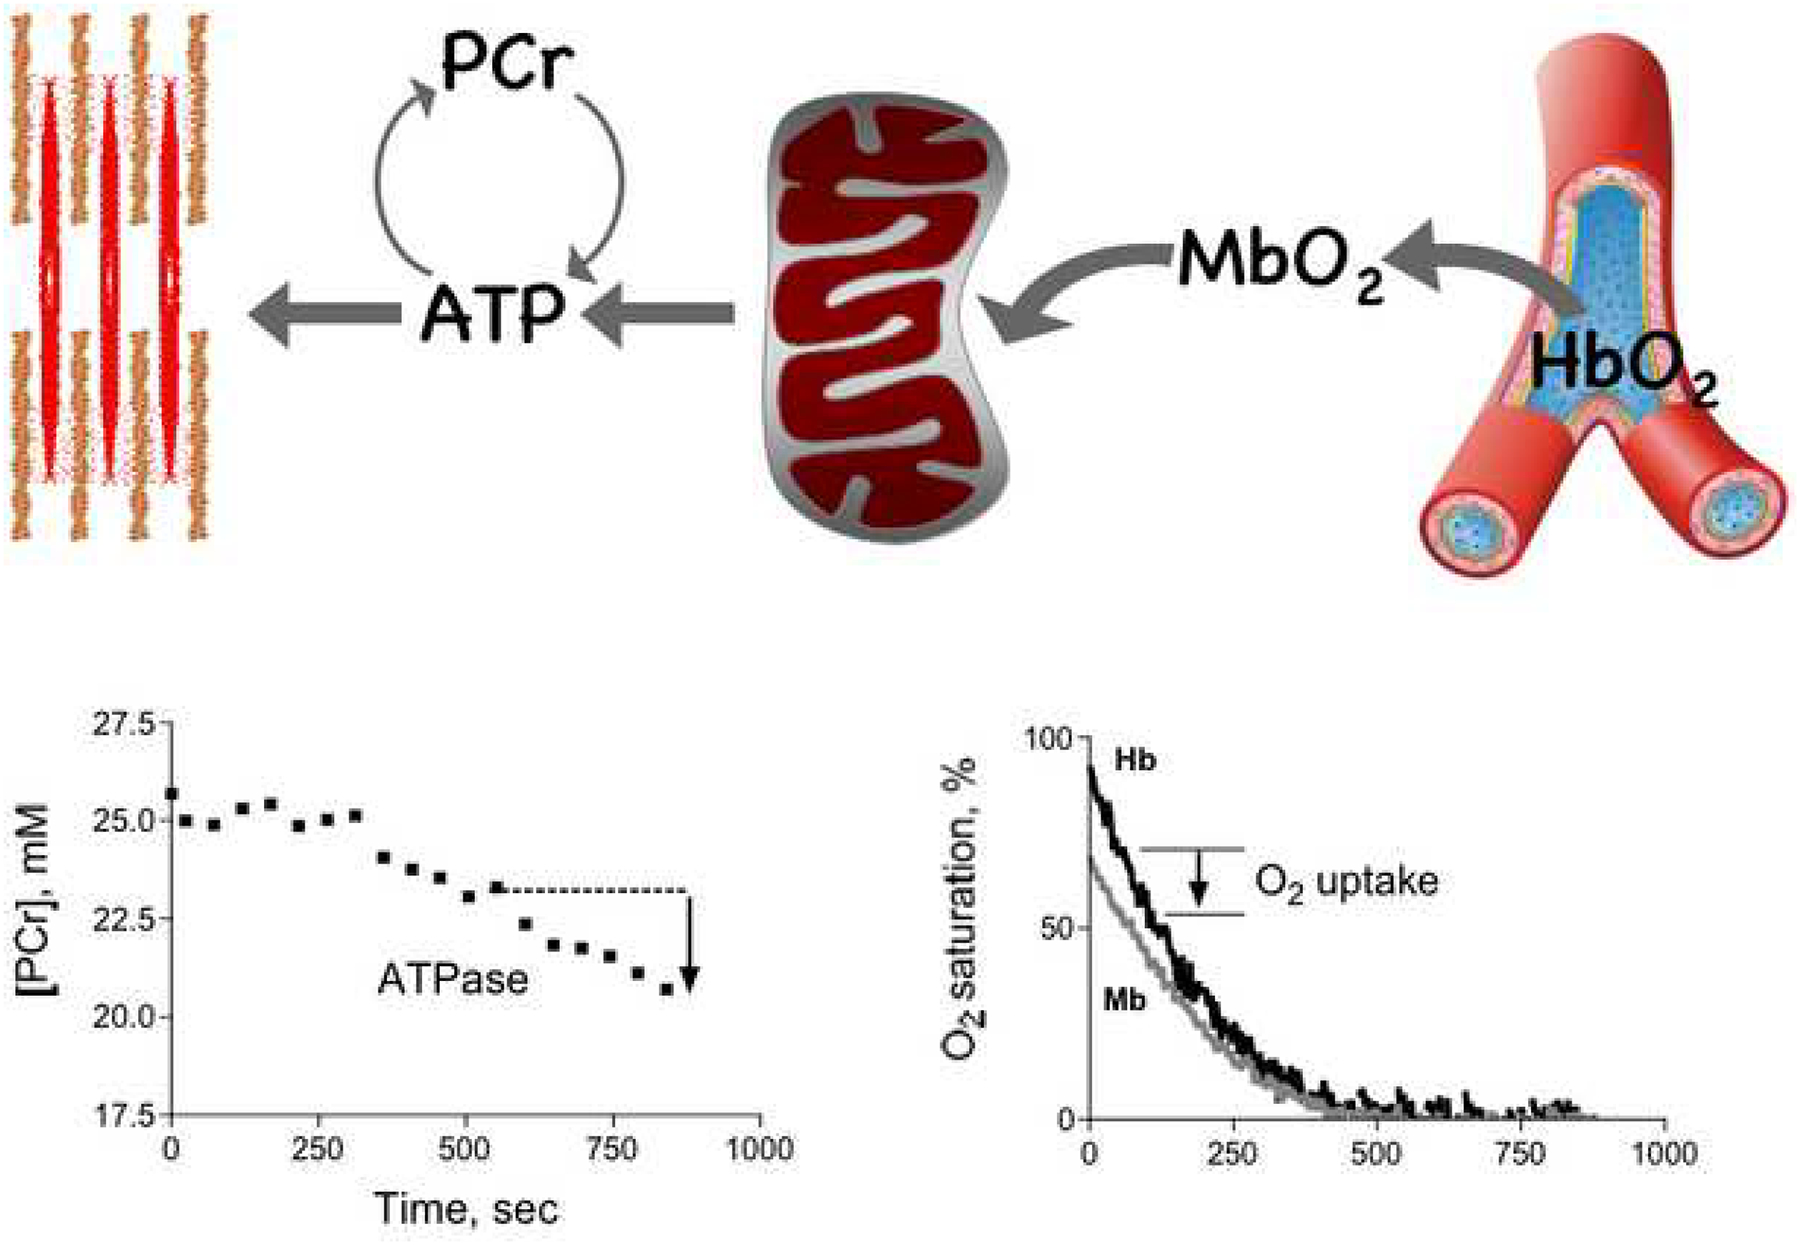
Mitochondria integrate the key metabolic fluxes in the cell. This role places this organelle at the center of cellular energetics and, hence, mitochondrial dysfunction underlies a growing number of human disorders and age-related degenerative diseases. Here we present novel analytical and technical methods for evaluating mitochondrial metabolism and (dys)function in human muscle in vivo. Three innovations involving advances in optical spectroscopy (OS) and magnetic resonance spectroscopy (MRS) permit quantifying key compounds in energy metabolism to yield mitochondrial oxidation and phosphorylation fluxes. The first of these uses analytical methods applied to optical spectra to measure hemoglobin (Hb) and myoglobin (Mb) oxygenation states and relative contents ([Hb]/[Mb]) to determine mitochondrial respiration (O2 uptake) in vivo. The second uses MRS methods to quantify key high-energy compounds (creatine phosphate, PCr, and adenosine triphosphate, ATP) to determine mitochondrial phosphorylation (ATP flux) in vivo. The third involves a functional test that combines these spectroscopic approaches to determine mitochondrial energy coupling (ATP/O2), phosphorylation capacity (ATP(max)) and oxidative capacity (O2max) of muscle. These new developments in optical and MR tools allow us to determine the function and capacity of mitochondria noninvasively in order to identify specific defects in vivo that are associated with disease in human and animal muscle. The clinical implication of this unique diagnostic probe is the insight into the nature and extent of dysfunction in metabolic and degenerative disorders, as well as the ability to follow the impact of interventions designed to reverse these disorders.
Figures


Similar articles
-
Mitochondrial efficiency in resting skeletal muscle in vivo: a novel non-invasive approach using multinuclear magnetic resonance spectroscopy in humans.J Physiol. 2025 Mar;603(6):1503-1519. doi: 10.1113/JP287412. Epub 2025 Feb 17. J Physiol. 2025. PMID: 39960635 Free PMC article.
-
Mitochondrial coupling in vivo in mouse skeletal muscle.Am J Physiol Cell Physiol. 2004 Feb;286(2):C457-63. doi: 10.1152/ajpcell.00237.2003. Epub 2003 Oct 1. Am J Physiol Cell Physiol. 2004. PMID: 14522819
-
Mitochondrial function, fibre types and ageing: new insights from human muscle in vivo.Exp Physiol. 2007 Mar;92(2):333-9. doi: 10.1113/expphysiol.2006.034330. Epub 2006 Dec 14. Exp Physiol. 2007. PMID: 17170059 Review.
-
Reduced mitochondrial coupling in vivo alters cellular energetics in aged mouse skeletal muscle.J Physiol. 2005 Dec 1;569(Pt 2):467-73. doi: 10.1113/jphysiol.2005.097782. Epub 2005 Oct 27. J Physiol. 2005. PMID: 16254011 Free PMC article.
-
Mitochondrial dysfunction measured in vivo.Acta Physiol Scand. 2004 Dec;182(4):343-52. doi: 10.1111/j.1365-201X.2004.01372.x. Acta Physiol Scand. 2004. PMID: 15569095 Review.
Cited by
-
In vivo metabolic spectroscopy identifies deficits in mitochondrial quality and capacity in aging skeletal muscle.Clin Pharmacol Ther. 2014 Dec;96(6):669-71. doi: 10.1038/clpt.2014.179. Epub 2014 Sep 10. Clin Pharmacol Ther. 2014. PMID: 25207702 Free PMC article. No abstract available.
-
Higher skeletal muscle mitochondrial oxidative capacity is associated with preserved brain structure up to over a decade.Nat Commun. 2024 Dec 30;15(1):10786. doi: 10.1038/s41467-024-55009-z. Nat Commun. 2024. PMID: 39737971 Free PMC article.
-
Mitochondrial Energetics in Skeletal Muscle Are Associated With Leg Power and Cardiorespiratory Fitness in the Study of Muscle, Mobility and Aging.J Gerontol A Biol Sci Med Sci. 2023 Aug 2;78(8):1367-1375. doi: 10.1093/gerona/glac238. J Gerontol A Biol Sci Med Sci. 2023. PMID: 36462195 Free PMC article.
-
Metabolic adaptation is not observed after 8 weeks of overfeeding but energy expenditure variability is associated with weight recovery.Am J Clin Nutr. 2019 Oct 1;110(4):805-813. doi: 10.1093/ajcn/nqz108. Am J Clin Nutr. 2019. PMID: 31204775 Free PMC article.
-
The Study of Muscle, Mobility and Aging (SOMMA): A Unique Cohort Study About the Cellular Biology of Aging and Age-related Loss of Mobility.J Gerontol A Biol Sci Med Sci. 2023 Oct 28;78(11):2083-2093. doi: 10.1093/gerona/glad052. J Gerontol A Biol Sci Med Sci. 2023. PMID: 36754371 Free PMC article.
References
Publication types
MeSH terms
Substances
Grants and funding
LinkOut - more resources
Full Text Sources
Medical
Miscellaneous
