Review
. 2009 Jan;1788(1):53-63.
doi: 10.1016/j.bbamem.2008.09.010. Epub 2008 Oct 1.

An introduction to critical points for biophysicists; observations of compositional heterogeneity in lipid membranes

Affiliations
Review

An introduction to critical points for biophysicists; observations of compositional heterogeneity in lipid membranes

Aurelia R Honerkamp-Smith et al. Biochim Biophys Acta. 2009 Jan.

Abstract

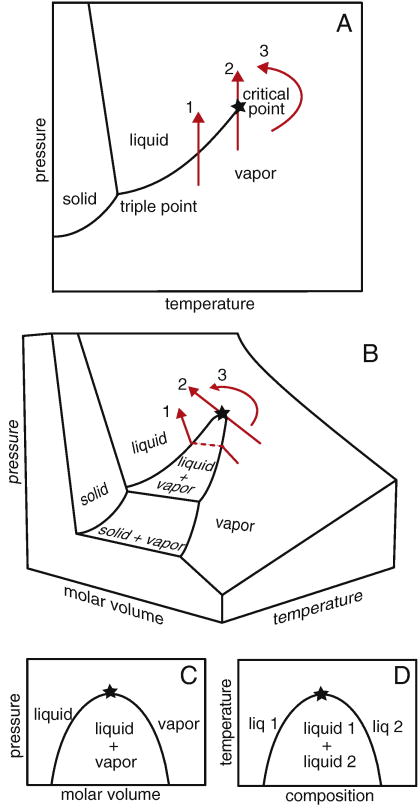
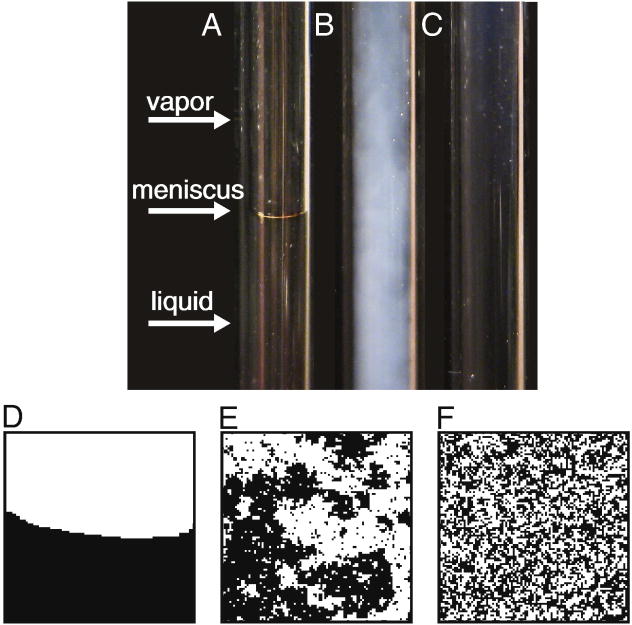
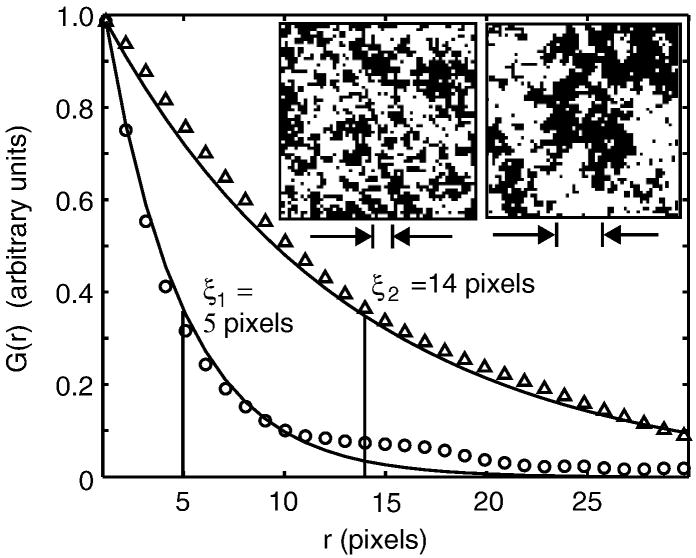
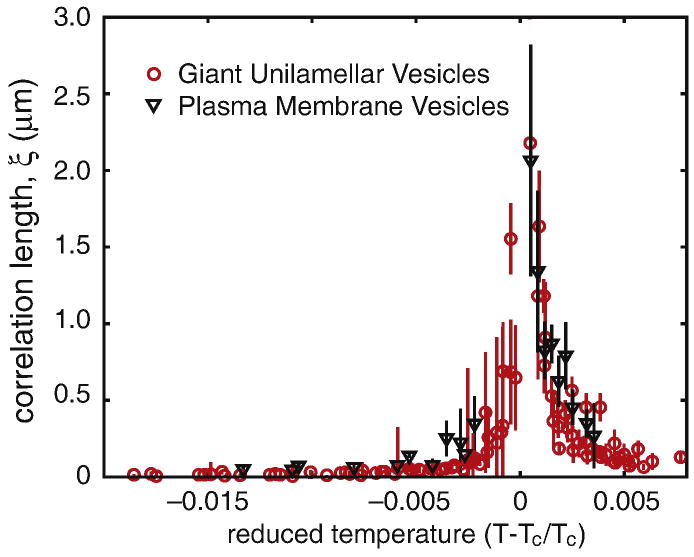
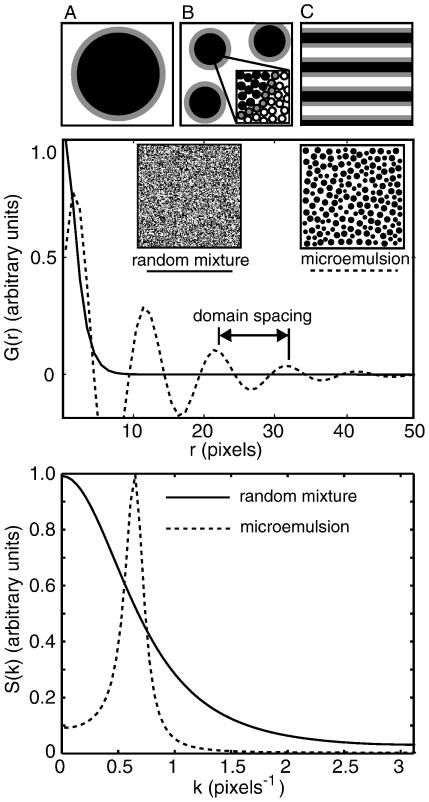
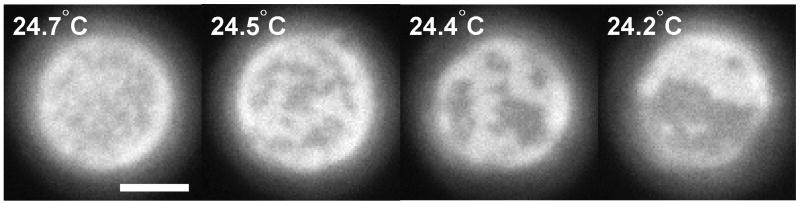
Scaling laws associated with critical points have the power to greatly simplify our description of complex biophysical systems. We first review basic concepts and equations associated with critical phenomena for the general reader. We then apply these concepts to the specific biophysical system of lipid membranes. We recently reported that lipid membranes can contain composition fluctuations that behave in a manner consistent with the two-dimensional Ising universality class. Near the membrane's critical point, these fluctuations are micron-sized, clearly observable by fluorescence microscopy. At higher temperatures, above the critical point, we expect to find submicron fluctuations. In separate work, we have reported that plasma membranes isolated directly from cells exhibit the same Ising behavior as model membranes do. We review other models describing submicron lateral inhomogeneity in membranes, including microemulsions, nanodomains, and mean field critical fluctuations, and we describe experimental tests that may distinguish these models.


Figures

Figure 1
Figure 1
(A) Phase diagram for water in the pressure-temperature plane. Path 1 crosses a coexistence line at which the vapor becomes a liquid. Along path 2, the same transition occurs at a critical point, which is marked with a star. Path 3 follows a continuous change from vapor to liquid without crossing the coexistence line. (B) The same paths are shown on a 3-dimensional phase diagram. (C) When molar volume is considered, there is a region of vapor and liquid coexistence, rather than merely a line. This region ends in a critical point. (D) The same type of phase diagram describes miscibility of two liquids, where the critical point is an upper consolute point.
Figure 2
Figure 2
(A) At room temperature, a glass tube filled with pressurized carbon dioxide contains liquid CO2 and vapor. A meniscus is clearly visible. Only the interior of the tube is shown. (B) The meniscus disappears when temperature is raised to the critical point. The observed cloudiness results from critical opalescence. (C) Above the critical temperature, the entire tube is filled with a single fluid phase. (D–F) The same behavior is captured by a simulation of the two-dimensional Ising model conducted far below (D), at (E), and far above (F) its critical temperature. The simulation was conducted as in (12) by Marcus Collins.
Figure 3
Figure 3
Insets show Ising model simulations conducted far above the critical temperature (left) and just above the critical temperature (right). The interaction parameter, J, has a value of 0.035kBT and 0.0425kBT, respectively. The graph shows angular-averaged autocorrelation functions G(r) vs. distance r, derived from the simulation images, where data from the left inset are plotted as circles, and data from the right as triangles. Correlation length, ξ, is defined by fitting to G(r) ∝ er/ξ, as shown by the solid line. The fit is conducted over the entire range of r in the simulation, but only shown for r < 30. The correlation length for each simulation is indicated by the distance between the arrows below each image. The high-temperature simulation has a correlation length of about 4 pixels (or lattice spacings). In contrast, the autocorrelation function for the system near a critical point decays more slowly, with a larger correlation length of ~14 pixels, reflecting the presence of long-distance correlations between points.
Figure 4
Figure 4
(A) A unilamellar vesicle is a thin spherical shell composed of a lipid bilayer, bounded by water on the inside and outside. When the composition of the bilayer is a ternary mixture of a lipid with a high melting temperature, a lipid with a low melting temperature, and cholesterol, the bilayer can contain micron scale coexisting liquid phases. (B) The two liquid phases contain different mole fractions of the three lipid types. For a “giant unilamellar vesicle” of radius >20 microns, the lipid bilayer is essentially locally flat. The critical behavior of this membrane is well described by (C) a 2-D lattice of “Ising spins” or (D) any equivalent thin sheet of material containing two states as long as the correlation length is greater than the thickness of the sheet. It is not helpful to picture the spins as electrons paired in an atomic orbital, or as electrical dipoles, which behave differently than the Ising spins described here.
Figure 5
Figure 5
Section of a membrane of a single giant unilamellar vesicle through time, at a series of temperatures. The membrane has a critical temperature of Tc~31.9°C. At 33.0°C, short-lived composition fluctuations are present. At 32.4°C, the fluctuations are larger and persist longer but the membrane remains homogeneous on average through time. At 31.75°C, just below the critical temperature, the membrane contains domains with a wide distribution of sizes. At 29.0°C, thermal fluctuations cause capillary waves which appear as rough domain edges. At 19.0°C, line tension is higher and domain edges are smooth. The vesicle was made and imaged as described previously (12). The vesicle is composed of 25:20:55 mol% of diphytanoyl phosphatidylcholine, dipalmitoyl phosphatidylcholine and cholesterol, with 0.8 mol% of the dye Texas Red dipalmitoyl phosphatidylethanolamine. Scale bar is 20 μm. The area shown in each image represents only ~4% of the vesicle surface area.
Figure 6
Figure 6
Diverging correlation length, ξ, vs. reduced temperature Tr = (TTc)/Tc for five different giant unilamellar vesicles (gray circles) and a single plasma membrane vesicle (black triangles). Equivalent data were published previously in figure 5 of (12) and figure 3 of (11). The data sets superimpose well, even though the compositions of the two membrane systems are different. For temperatures below Tc, we have used ξ = (kB Tc)/λ, as described in (12).
Figure 7
Figure 7
Top: Sketches of an emulsion (A), microemulsion (B), and lamellar phase (C) in which grey surfactant molecules line the boundary between the white and black phases. Middle: Autocorrelation functions G(r) for a disordered fluid (solid line) and a microemulsion (dashed line) are plotted vs. distance r from the functional forms given in reference (42). The insets are illustrative sketches. Bottom: Structure factors S(k) are obtained by transforming the autocorrelation functions shown in the middle panel.
Figure 8
Figure 8
Critical fluctuations are observed in giant plasma membrane vesicle (GPMV) prepared as described in reference (11) and fluorescently labeled with the fluorescent dye diIC12. The vesicle’s critical temperature is ~24.3°C. The scale bar is 5 microns.
Figure 9
Figure 9
Three mechanisms for approaching a critical point as shown in figure 1d. (A) Temperature is changed at a constant membrane composition. (B) The ratio of existing lipids in a membrane is changed at constant temperature. (C) Introduction of new membrane components or crosslinking of lipids or proteins shifts the phase boundary to a higher temperature.

References

    1. Weisenfeld K. Resource Letter: ScL-1: Scaling Laws. Am J Phys. 2001;69:938–942.
    1. Liu Y, Dilger JP. Application of the one- and two-dimensional Ising models to studies of cooperativity between ion channels. Biophys J. 1993;64:26–35. - PMC - PubMed
    1. Schneidman E, Berry MJ, II, Segev R, Bialek W. Weak pairwise correlations imply strongly correlated network states in a neural population. Nature. 2006;440:1007–1012. - PMC - PubMed
    1. Wetzel SK, Settanni G, Kenig M, Binz HK, Plückthun A. Folding and unfolding mechanism of highly stable full-consensus ankyrin repeat proteins. J Mol Biol. 2008;376:241–257. - PubMed
    1. Cellmer T, Henry ER, Kubelka J, Hofrichter J, Eaton WA. Relaxation rate for an ultrafast folding protein is independent of chemical denaturant concentration. J Am Chem Soc. 2007;129:14564–14565. - PubMed

Publication types

LinkOut - more resources