

A pharmacological comparison of the cloned frog and human mu opioid receptors reveals differences in opioid affinity and function
- PMID: 18930720
- PMCID: PMC2600596
- DOI: 10.1016/j.ejphar.2008.09.043
A pharmacological comparison of the cloned frog and human mu opioid receptors reveals differences in opioid affinity and function
Abstract
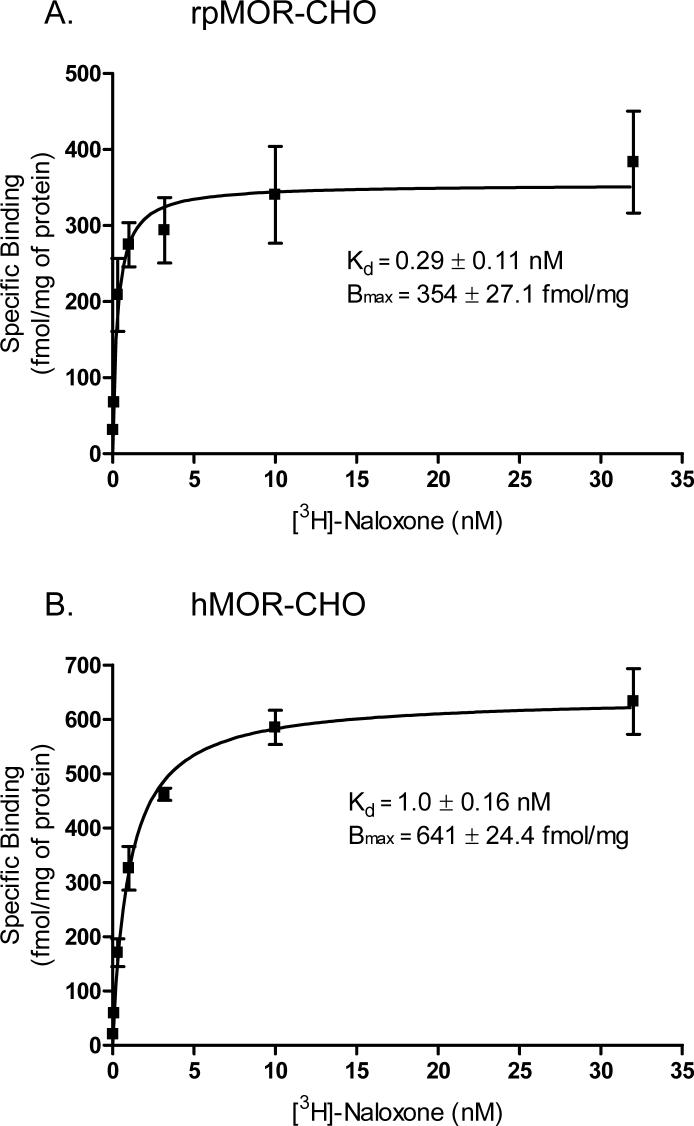
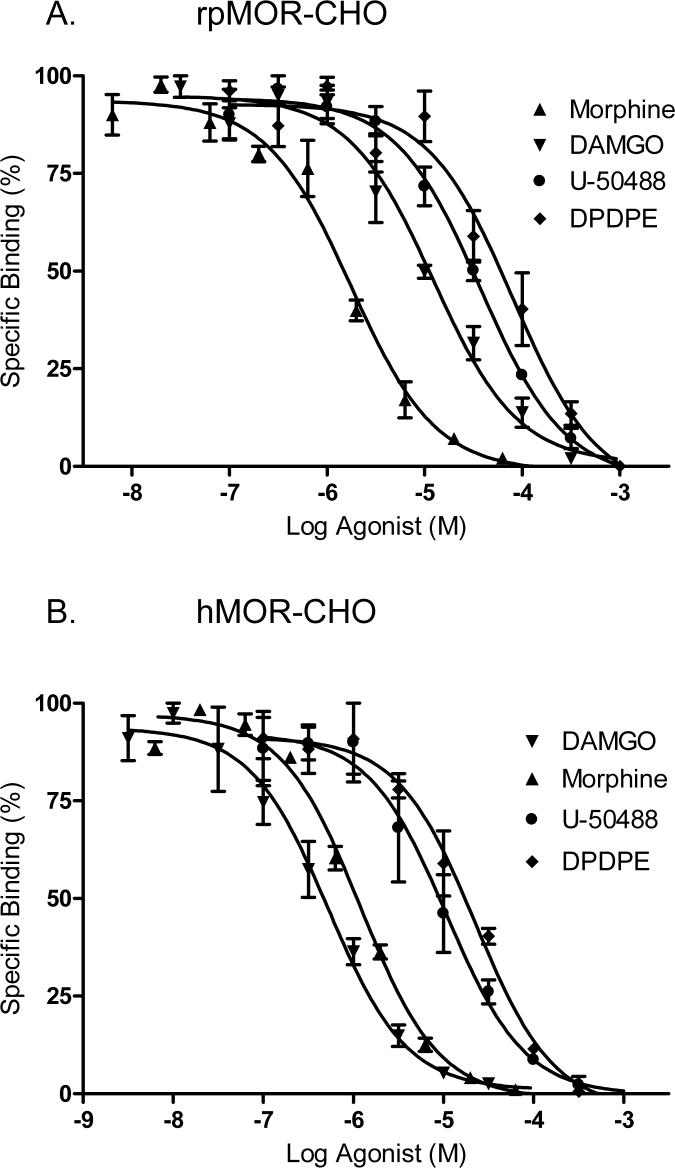
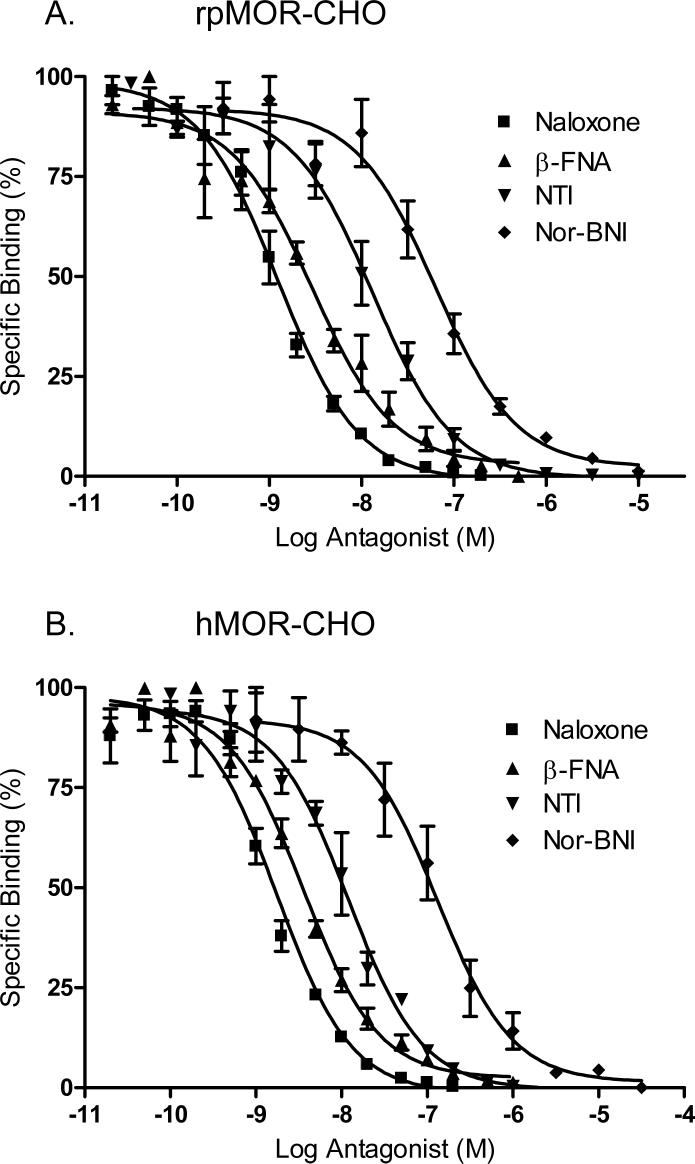
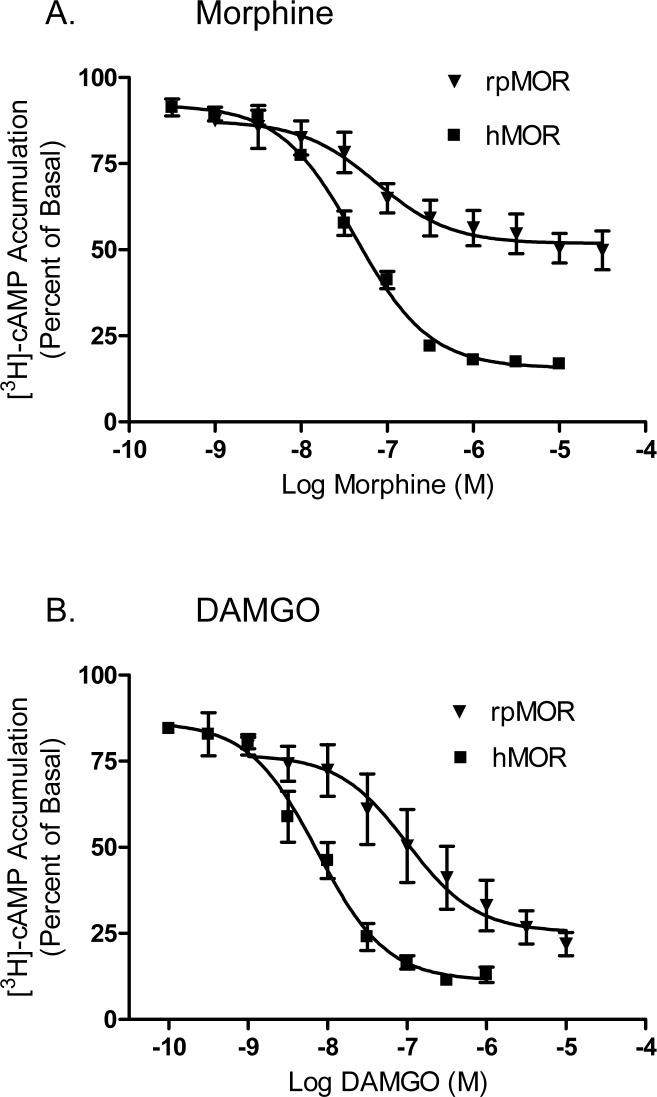
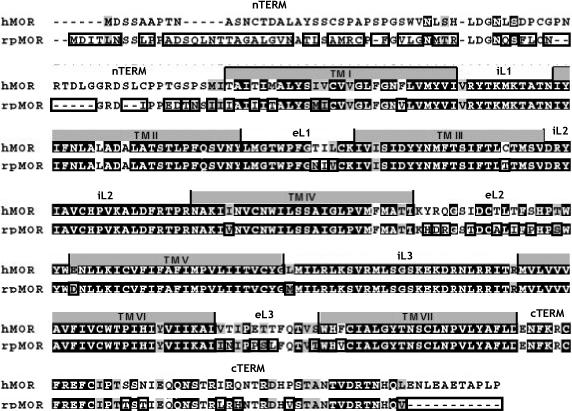
This study presents a direct comparison of the ligand binding and signaling profiles of a mammalian and non-mammalian mu opioid receptor. Opioid ligand binding and agonist potencies were determined for an amphibian (Rana pipiens) mu opioid receptor (rpMOR) and the human mu opioid receptor (hMOR) in transfected, intact Chinese hamster ovary (CHO) cells. Identical conditions were employed such that statistically meaningful differences between the two receptors could be determined. Identifying these differences is an important first step in understanding how evolutionary changes affect ligand binding and signaling in vertebrate opioid receptors. As expected, the rank of opioid ligand affinity for rpMOR and hMOR was consistent with the ligands' previously characterized type-selectivity. However, most of the opioid ligands tested had significant differences in affinity for rpMOR and hMOR. For example, the mu-selective agonist, DAMGO ([d-Ala(2), N-Me-Phe(4), Gly(5)-ol]-enkephalin), had a 10.9-fold greater affinity (K(i)) for hMOR (K(i)=268 nM) than rpMOR (K(i)=2914 nM). In addition, differences in signaling between these receptors were found by measuring inhibition of cAMP accumulation by morphine or DAMGO. DAMGO was significantly more potent (13.6-fold) in CHO cells expressing hMOR versus those expressing rpMOR. In addition, a significantly greater maximal inhibition was elicited by both opioid agonists in cells expressing hMOR. In summary, this study supports an ongoing effort to better understand how vertebrate evolution has shaped opioid receptor properties and function.
Figures
Similar articles
-
Opioid peptide receptor studies. 16. Chronic morphine alters G-protein function in cells expressing the cloned mu opioid receptor.Synapse. 2003 Jan;47(1):1-9. doi: 10.1002/syn.10144. Synapse. 2003. PMID: 12422367
-
Differential effects of opioid agonists on G protein expression in CHO cells expressing cloned human opioid receptors.Brain Res Bull. 2008 Sep 5;77(1):49-54. doi: 10.1016/j.brainresbull.2008.05.003. Epub 2008 Jun 4. Brain Res Bull. 2008. PMID: 18639745 Free PMC article.
-
Comparison of [Dmt1]DALDA and DAMGO in binding and G protein activation at mu, delta, and kappa opioid receptors.J Pharmacol Exp Ther. 2003 Dec;307(3):947-54. doi: 10.1124/jpet.103.054775. Epub 2003 Oct 8. J Pharmacol Exp Ther. 2003. PMID: 14534366
-
A comparison of noninternalizing (herkinorin) and internalizing (DAMGO) mu-opioid agonists on cellular markers related to opioid tolerance and dependence.Synapse. 2007 Mar;61(3):166-75. doi: 10.1002/syn.20356. Synapse. 2007. PMID: 17152090
-
Effects of chronic opioid exposure on guinea pig mu opioid receptor in Chinese hamster ovary cells: comparison with human and rat receptor.Biochem Pharmacol. 2007 Jun 1;73(11):1818-28. doi: 10.1016/j.bcp.2007.02.001. Epub 2007 Feb 12. Biochem Pharmacol. 2007. PMID: 17343833 Free PMC article.
Cited by
-
Higher naloxone dosing in a quantitative systems pharmacology model that predicts naloxone-fentanyl competition at the opioid mu receptor level.PLoS One. 2020 Jun 16;15(6):e0234683. doi: 10.1371/journal.pone.0234683. eCollection 2020. PLoS One. 2020. PMID: 32544184 Free PMC article.
-
Single Amino Acid Variation Underlies Species-Specific Sensitivity to Amphibian Skin-Derived Opioid-like Peptides.Chem Biol. 2015 Jun 18;22(6):764-75. doi: 10.1016/j.chembiol.2015.05.012. Chem Biol. 2015. PMID: 26091169 Free PMC article.
-
Analgesia in amphibians: preclinical studies and clinical applications.Vet Clin North Am Exot Anim Pract. 2011 Jan;14(1):33-44. doi: 10.1016/j.cvex.2010.09.007. Vet Clin North Am Exot Anim Pract. 2011. PMID: 21074701 Free PMC article. Review.
References
-
- Alvarez FA, Rodriguez-Martin I, Gonzalez-Nunez V, de Velasco EM, Gonzalez SR, Rodriguez RE. New kappa opioid receptor from zebrafish Danio rerio. Neurosci. Lett. 2006;405:94–99. - PubMed
-
- Barrallo A, González-Sarmiento R, Porteros A, Gracia-Isídoro M, Rodríguez RE. Cloning, molecular characterization, and distribution of a gene homologous to delta opoid receptor from zebrafish (Danio rerio). Biochem. Biophys. Res. Commun. 1998;245:544–548. - PubMed
-
- Barrallo A, González-Sarmiento R, Alvar F, Rodriguez RE. ZFOR2, a new opioid receptor-like gene from the teleost zebrafish (Danio rerio). Mol. Brain Res. 2000;84:1–6. - PubMed
-
- Benyhe S, Varga E, Hepp J, Magyar A, Borsodi A, Wollemann M. Characterization of kappa1 and kappa2 opioid binding sites in frog (Rana esculenta) brain membrane. Neurochem. Res. 1990;15:899–904. - PubMed
-
- Benyhe S, Monory K, Farkas J, Toth G, Guerrini R, Salvadori S, Orosz G, Wollemann M, Borsodi A. Nociceptin binding sites in frog (Rana esculenta) brain membranes. Biochem. Biophys. Res. Commun. 1999;260:592–596. - PubMed
Publication types
MeSH terms
Substances
Grants and funding
LinkOut - more resources
Full Text Sources
Research Materials
