. 2008 Dec;74(24):7497-506.
doi: 10.1128/AEM.01626-08. Epub 2008 Oct 17.

Development and application of flow-cytometric techniques for analyzing and sorting endospore-forming clostridia

Affiliations

Development and application of flow-cytometric techniques for analyzing and sorting endospore-forming clostridia

Bryan P Tracy et al. Appl Environ Microbiol. 2008 Dec.

Abstract

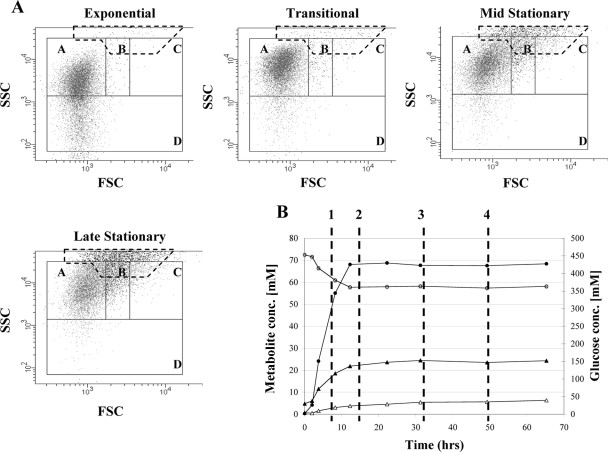
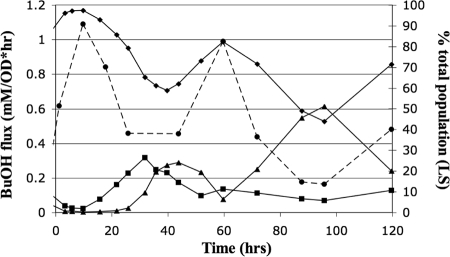
The study of microbial heterogeneity at the single-cell level is a rapidly growing area of research in microbiology and biotechnology due to its significance in pathogenesis, environmental biology, and industrial biotechnologies. However, the tools available for efficiently and precisely probing such heterogeneity are limited for most bacteria. Here we describe the development and application of flow-cytometric (FC) and fluorescence-assisted cell-sorting techniques for the study of endospore-forming bacteria. We show that by combining FC light scattering (LS) with nucleic acid staining, we can discriminate, quantify, and enrich all sporulation-associated morphologies exhibited by the endospore-forming anaerobe Clostridium acetobutylicum. Using FC LS analysis, we quantitatively show that clostridial cultures commonly perform multiple rounds of sporulation and that sporulation is induced earlier by the overexpression of Spo0A, the master regulator of endospore formers. To further demonstrate the power of our approach, we employed FC LS analysis to generate compelling evidence to challenge the long-accepted view in the field that the clostridial cell form is the solvent-forming phenotype.


Figures

FIG. 1.
FIG. 1.
LS investigation and metabolite analysis of a typical sporulating 824(pSOS95del) static flask culture. (A) Metabolite profiles, growth curves, and identification of batch culture stages. Symbols: ×, A600; ▴, acetate; •, butyrate; □, acetone; ▵, ethanol; and ○, butanol. Batch culture stages are identified by black bars as follows: 1, exponential; 2, transition; 3, early stationary; 4, mid-stationary; and 5, late stationary. (B) Dot plots from the LS (FSC/SSC) analysis. Dot plots were gated into four regions as follows: A, low FSC/high SSC; B, mid-FSC/high SSC; C, high FSC/high SSC; and D, all FSC/low SSC. (C) Composition of cell population for each LS region in the panel B dot plots shown as the percentage of total population. (D) Phase-contrast microscopy of the same sample analyzed by FC. Numbers on microscopy images correspond to the numbers on dot plots. Arrows point to the morphologies we are most interested in identifying and quantifying by FC. conc., concentration.
FIG. 2.
FIG. 2.
LS characteristics of an asporogeneous M5 culture. (A) LS dot plots from various stages of the batch culture. The broken gate encompasses the disperse high-intensity FSC-SSC events, which are characteristic of a metabolically inactive culture and absent from an actively metabolizing culture. (B) Metabolite profiles and growth curve for a typical M5 batch culture. Symbols: ○, glucose; ▴, acetate; •, butyrate; and ▵, ethanol. There was no measurable butanol or acetone. Samples corresponding to the dot plots in panel A are marked with numbers as follows: 1, exponential; 2, transition; 3, mid-stationary; and 4, late stationary. Notice that between hours 20 and 25, metabolite concentrations do not change appreciably, suggesting that the culture is no longer metabolically active. This corresponds to the time at which disperse high-intensity FSC-SSC events become more prevalent and the culture is unable to be serially cultured. conc., concentration.
FIG. 3.
FIG. 3.
Refinement of LS investigation with NA staining for both early- and late-stationary-phase samples of an 824(pSOS95del) batch culture. Populations were sorted based upon the combination of LS and NA staining characteristics. (A) LS and NA staining dot plots for an early-stationary-phase sample. We sorted the following four populations by FACS: R1, B (PI/Syto+ and mid-FSC/high SSC); R2, B (PI+/Sytodim and mid-FSC/high SSC); R1, A (PI/Syto+ and low FSC/high SSC); and R2, A (PI+/Sytodim and low FSC/high SSC). Percentages within each NA gate for the respective LS gate are indicated. (B) Microscopy of sorted populations from the early-stationary-phase sample. (C) LS and NA staining dot plots for the late-stationary-phase sample. The following two populations were sorted by FACS: R3, C (Syto+/PIdim and high FSC/high SSC); and R4, C (Sytodim/PIdim and high FSC/high SSC). The percentage within each NA gate for the respective LS gate C is indicated. (D) Microscopy of sorted populations from the late-stationary-phase sample. (E) Summary of the predominant morphologies for each sorted population. *, postsorting analysis revealed that forespore-containing cells exhibited LS characteristics very near the border of gates A and B. We expanded gate B and sorted again to show that gate B captures predominately clostridial-form cells and forespores (Fig. 4).
FIG. 4.
FIG. 4.
TEM of sorted cells from LS gates B (panels A and B) and C (panels C and D) (refer to Fig. 3). Clostridial-form cells and forespore-containing cells were the predominant morphologies in all fields of view for LS gate B, and endospore-containing cells and free spores were predominant for LS gate C. (A) Clostridial-form cells with arrows pointing to granulose (GR) and asymmetric septum formation (AS). (B) Forespore-containing cells, which all contained granulose. Arrows are pointing to the developing forespore (FS). (C) Endospore-containing cells and free spores with arrows pointing to the spore coat (SC) and the spore cortex (CX). (D) Mature endospore-containing cell with what appears to be an exosporium (EX) surrounding the endospore.
FIG. 5.
FIG. 5.
Temporal analysis of batch culture sporulation for multiple strains of C. acetobutylicum, which proved multiple rounds of sporulation. Dot plots for typical WT (top row) and 824(pSOS95del) (bottom row) cultures showed that the endospore-containing cell/free spore population (gate C) develops, disappears, and then develops again as the culture ages. The percentage of cells within the entire population that exhibited gate C characteristics is provided on each dot plot. Our data demonstrated germination of spores, multiple rounds of sporulation, and synchrony for the first round of germination. Results were similar for all differentiating cultures analyzed (seven for this study).
FIG. 6.
FIG. 6.
Correlation between LS characteristics and butanol flux for 824(pSOS95del). Graphs are labeled with the following symbols: ♦ plus a solid line, rod-shaped, vegetative population; ▪ plus a solid line, clostridial-form cell population; ▴ plus a solid line, endospore-containing cell/free spore population; and • plus a broken line, butanol flux. Notice that changes in butanol flux correlated directly with the changes in the percentage of vegetative cells and inversely with the percentage of clostridial-form cells. Decreases in endospore-containing cell/free spore population were indicative of germination, which correlated with increases in vegetative population and butanol flux. OD, optical density.

References

    1. Avery, S. V. 2006. Microbial cell individuality and the underlying sources of heterogeneity. Nat. Rev. Microbiol. 4:577-587. - PubMed
    1. Balaban, N. Q., J. Merrin, R. Chait, L. Kowalik, and S. Leibler. 2004. Bacterial persistence as a phenotypic switch. Science 305:1622-1625. - PubMed
    1. Berney, M., F. Hammes, F. Bosshard, H. U. Weilenmann, and T. Egli. 2007. Assessment and interpretation of bacterial viability by using the LIVE/DEAD BacLight kit in combination with flow cytometry. Appl. Environ. Microbiol. 73:3283-3290. - PMC - PubMed
    1. Brehm-Stecher, B. F., and E. A. Johnson. 2004. Single-cell microbiology: tools, technologies, and applications. Microbiol. Mol. Biol. Rev. 68:538. - PMC - PubMed
    1. Clark, S. W., G. N. Bennett, and F. B. Rudolph. 1989. Isolation and characterization of mutants of Clostridium acetobutylicum ATCC 824 deficient in acetoacetyl-coenzyme A:acetate/butyrate:coenzyme A-transferase (EC 2.8.3.9) and in other solvent pathway enzymes. Appl. Environ. Microbiol. 55:970-976. - PMC - PubMed

Publication types

MeSH terms

LinkOut - more resources