

Expression profiling of rice cultivars differing in their tolerance to long-term drought stress
- PMID: 18931976
- PMCID: PMC2709230
- DOI: 10.1007/s11103-008-9412-7
Expression profiling of rice cultivars differing in their tolerance to long-term drought stress
Abstract
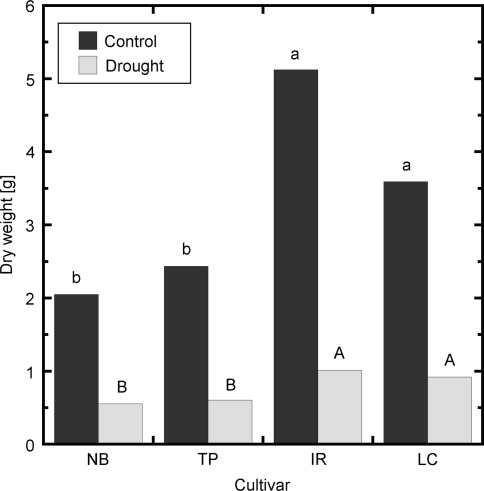
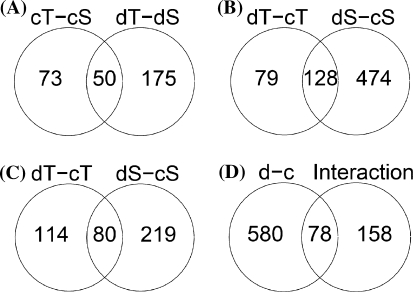
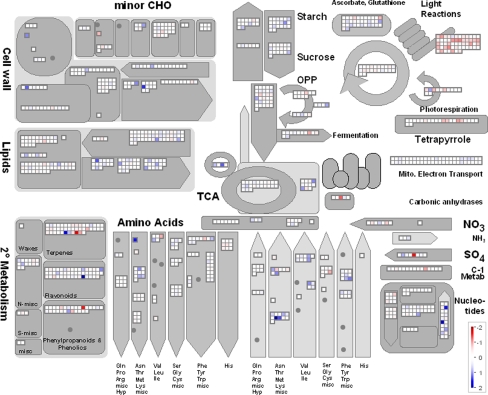
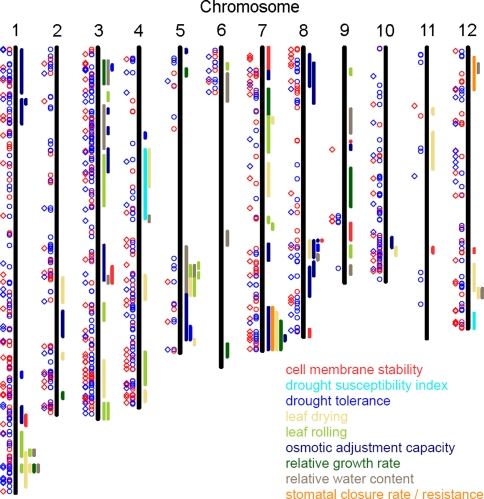
Understanding the molecular basis of plant performance under water-limiting conditions will help to breed crop plants with a lower water demand. We investigated the physiological and gene expression response of drought-tolerant (IR57311 and LC-93-4) and drought-sensitive (Nipponbare and Taipei 309) rice (Oryza sativa L.) cultivars to 18 days of drought stress in climate chamber experiments. Drought stressed plants grew significantly slower than the controls. Gene expression profiles were measured in leaf samples with the 20 K NSF oligonucleotide microarray. A linear model was fitted to the data to identify genes that were significantly regulated under drought stress. In all drought stressed cultivars, 245 genes were significantly repressed and 413 genes induced. Genes differing in their expression pattern under drought stress between tolerant and sensitive cultivars were identified by the genotype x environment (G x E) interaction term. More genes were significantly drought regulated in the sensitive than in the tolerant cultivars. Localizing all expressed genes on the rice genome map, we checked which genes with a significant G x E interaction co-localized with published quantitative trait loci regions for drought tolerance. These genes are more likely to be important for drought tolerance in an agricultural environment. To identify the metabolic processes with a significant G x E effect, we adapted the analysis software MapMan for rice. We found a drought stress induced shift toward senescence related degradation processes that was more pronounced in the sensitive than in the tolerant cultivars. In spite of higher growth rates and water use, more photosynthesis related genes were down-regulated in the tolerant than in the sensitive cultivars.
Figures
References
-
- {'text': '', 'ref_index': 1, 'ids': [{'type': 'PubMed', 'value': '2231712', 'is_inner': True, 'url': 'https://pubmed.ncbi.nlm.nih.gov/2231712/'}]}
- Altschul SF, Gish W, Miller W et al (1990) Basic local alignment search tool. J Mol Biol 215:403–410 - PubMed
-
- None
- Babu RC, Nguyen BD, Chamarerk V et al (2003) Genetic analysis of drought resistance in rice by molecular markers: association between secondary traits and field performance. Crop Sci 43:1457–1469
-
- None
- Banoc DM, Yamauchi A, Kamoshita A et al (2000) Dry matter production and root system development of rice cultivars under fluctuating soil moisture. Plant Prod Sci 3:197–207
-
- None
- Benjamini Y, Hochberg Y (1995) Controlling the false discovery rate: a practical and powerful approach to multiple testing. J R Stat Soc Ser B 57:289–300
-
- {'text': '', 'ref_index': 1, 'ids': [{'type': 'DOI', 'value': '10.1016/S0378-4290(99)00064-7', 'is_inner': False, 'url': 'https://doi.org/10.1016/s0378-4290(99)00064-7'}]}
- Blum A, Zhang J, Nguyen HT (1999) Consistent differences among wheat cultivars in osmotic adjustment and their relationship to plant production. Field Crops Res 64:287–291. doi:10.1016/S0378-4290(99)00064-7
Publication types
MeSH terms
LinkOut - more resources
Full Text Sources
Other Literature Sources
Molecular Biology Databases
