. 2009 Mar;8(3):421-32.
doi: 10.1074/mcp.M800190-MCP200. Epub 2008 Oct 20.

An enhanced mass spectrometry approach reveals human embryonic stem cell growth factors in culture

Affiliations

An enhanced mass spectrometry approach reveals human embryonic stem cell growth factors in culture

Sean C Bendall et al. Mol Cell Proteomics. 2009 Mar.

Abstract

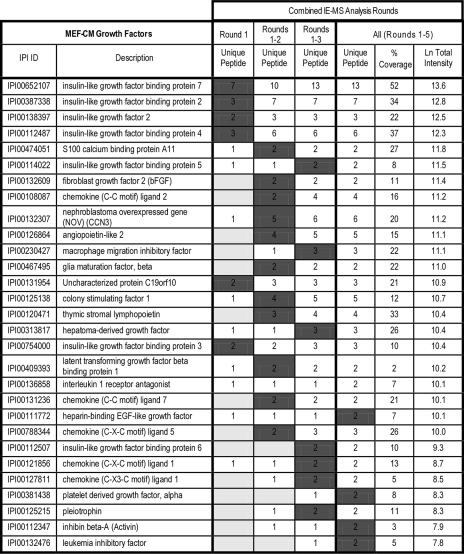
The derivation and long-term maintenance of human embryonic stem cells (hESCs) has been established in culture formats that are both dependent and independent of support (feeder) cells. However, the factors responsible for preserving the viability of hESCs in a nascent state remain unknown. We describe a mass spectrometry-based method for probing the secretome of the hESC culture microenvironment to identify potential regulating protein factors that are in low abundance. Individual samples were analyzed several times, using successive mass (m/z) and retention time-directed exclusion, without sampling the same peptide ion twice. This iterative exclusion -mass spectrometry (IE-MS) approach more than doubled protein and peptide metrics in comparison to a simple repeat analysis method on the same instrument, even after extensive sample pre-fractionation. Furthermore, implementation of the IE-MS approach was shown to enhance the performance of an older quadrupole time of flight (Q-ToF) MS. The resulting number of identified peptides approached that of a parallel repeat analysis on a newer LTQ-Orbitrap MS. The combination of the results of both instruments proved to be superior to that achieved by a single instrument in the identification of additional proteins. Using the IE-MS strategy, combined with complementary gel- and solution-based fractionation methods, the hESC culture microenvironment was extensively probed. Over 10 to 12 times more extracellular proteins were observed compared with previously published surveys. The detection of previously undetectable growth factors, present at concentrations ranging from 10(-9) to 10(-11) g/ml, highlights the depth of our profiling. The IE-MS approach provides a simple and reliable technique that greatly enhances instrument performance by increasing the effective depth of MS-based proteomic profiling. This approach should be widely applicable to any LC-MS/MS instrument platform or biological system.


Figures

F<sc>ig</sc>. 1.
Fig. 1.
Schematic description of the sample preparation and analyses of hESC- and MEF-CM. The extraction, fractionation, and MS-based analytical strategy applied to the proteins in CM from feeder cells (MEF-CM) or hESCs cultured-free of feeder cells (hESC-CM). Biological duplicates of MEF-CM and hESC-CM were analyzed. 50 μg of protein from each replicate was analyzed using Gel-enhanced (GeLC-MS), MuD-PIT, and no-pre-fractionation analysis. Nano-LC-MS/MS was then performed multiple times on each fraction utilizing our m/z and RT-driven IE-MS strategy.
F<sc>ig</sc>. 2.
Fig. 2.
A schematic of the iterative exclusion-liquid chromatography-tandem mass spectrometry (IE-LC-MS/MS) approach. a, during repeat data-dependent MS analysis of the same sample, peptide ions of higher spectral abundance are preferentially selected for MS/MS. In later rounds of analysis, at a given RT, previously selected peptide ions are excluded based on m/z to force the analysis of ions of lower spectral abundance. b, to minimize the exclusion footprint and maximize IE analysis coverage a shift of 0.7 ± 0.8 is added to the previously acquired ion's m/z to create a narrow, but all-encompassing generic exclusion window for a peptide ion's isotopic envelope.
F<sc>ig</sc>. 3.
Fig. 3.
Direct comparison of IE-MS analysis to basic repeat injection. Three large MEF-CM fractions from gel separation were each analyzed by five rounds of LC-MS/MS using identical instrumental and sampling parameters. One set was simply analyzed five times (repeat injection) where the second set, starting with the same initial run, was analyzed using the IE strategy. The mean and S.D. (n = 3) of the relative number of unique (a) proteins and (b) peptides cumulatively identified over each round of analysis for each method. For the first and fifth analysis rounds, the total numbers of unique peptides or proteins identified in combined MEF-CM or fractions is indicated for each method. The resulting data for the three different fractions were pooled for each method and filtered to only proteins identified with >2 unique peptides. c, frequency of how many rounds (out of 5 total) a unique peptide was identified using repeat injection or IE-MS analysis. Heat maps for (d) repeat injection and (e) iterative exclusion where each row corresponds to a protein identification sorted by total spectral intensity show which round of analysis two or more unique peptides were identified (red square), and whether a particular protein was unique to that analysis strategy (blue square).
F<sc>ig</sc>. 4.
Fig. 4.
Comparison of IE-MS Q-ToF to repeat LTQ-Orbitrap analysis. Three large MEF-CM fractions from gel separation were each analyzed by five rounds of LC-MS/MS using identical amounts and LC conditions. One set was simply analyzed five times on a fast scanning LTQ-Orbitrap (1 s MS, 3 × 0.33 s MS/MS, 2 s duty cycle - repeat injection), whereas the second set was analyzed using the IE strategy on a slower scanning Q-ToF (1s MS, 4 × 1s MS/MS, 5 s duty cycle). The mean and S.D. (n = 3) of the relative number of unique (a) peptides and (b) proteins cumulatively identified over each round of analysis for each method or based on the two datasets combined. For the first and fifth analysis rounds, the total numbers of unique peptides or proteins identified in combined MEF-CM or fractions is indicated for each method.
F<sc>ig</sc>. 5.
Fig. 5.
The benefit of IE in LC-MS/MS analysis of complex mixtures with sample pre-fractionation. Following five rounds of IE-MS analysis, the mean and S.D. (n = 4) of the relative number of unique proteins and peptides identified in the MEF and hESC-CM replicates relative to the initial analysis using (a) no pre-fractionation, (b) MuD-PIT, (c) gel-enhanced, or (d) datasets from all methods combined. d, the average mass spectral intensity of newly identified unique peptides relative to the initial analysis for each pre-fractionation approach. For the first and fifth IE-MS rounds, the total numbers of unique peptides or proteins identified in combined MEF-CM or hESC-CM replicates is indicated for each method.
F<sc>ig</sc>. 6.
Fig. 6.
Table of extracellular protein growth factors identified in MEF-CM. High confidence protein growth factors identified in hESC feeder cell conditioned medium (MEF-CM). Based on combined analysis of replicates utilizing all pre-fractionation approaches, all factors were identified with > 2 unique peptides. Entries are listed according to total spectral intensity of unique peptides with the total unique peptides numbers identified for each analysis round. To illustrate IE analysis accessing species of lower spectral abundance each entry was highlighted in the round in which it was identified with two or more peptides.
F<sc>ig</sc>. 7.
Fig. 7.
Table of extracellular protein growth factors identified in hESC-CM. High confidence protein growth factors identified in hESC conditioned medium (hESC-CM) in the absence of MEF-CM. Based on combined analysis of replicates (H1 and H9 hESCs) utilizing all pre-fractionation approaches, all factors were identified with >2 unique peptides and were observed in both biological replicates. Entries are listed according to total spectral intensity of unique peptides with the total unique peptides numbers identified for each analysis round. To illustrate IE analysis accessing species of lower spectral abundance each entry was highlighted in the round in which it was identified with two or more peptides.

References

    1. Reubinoff, B. E., Pera, M. F., Fong, C. Y., Trounson, A., and Bongso, A. ( 2000) Embryonic stem cell lines from human blastocysts: somatic differentiation in vitro. Nat. Biotechnol. 18, 399–404 - PubMed
    1. Thomson, J. A., Itskovitz-Eldor, J., Shapiro, S. S., Waknitz, M. A., Swiergiel, J. J., Marshall, V. S., and Jones, J. M. ( 1998) Embryonic stem cell lines derived from human blastocysts. Science 282, 1145–1147 - PubMed
    1. Menendez, P., Wang, L., and Bhatia, M. ( 2005) Genetic manipulation of human embryonic stem cells: a system to study early human development and potential therapeutic applications. Curr. Gene Ther. 5, 375–385 - PubMed
    1. Evans, M. J., and Kaufman, M. H. ( 1981) Establishment in culture of pluripotential cells from mouse embryos. Nature 292, 154–156 - PubMed
    1. Hoffman, L. M., and Carpenter, M. K. ( 2005) Characterization and culture of human embryonic stem cells. Nat. Biotechnol. 23, 699–708 - PubMed

Publication types

LinkOut - more resources