. 2008 Dec 1;586(23):5743-55.
doi: 10.1113/jphysiol.2008.162040. Epub 2008 Oct 20.

Spontaneous purinergic neurotransmission in the mouse urinary bladder

Affiliations

Spontaneous purinergic neurotransmission in the mouse urinary bladder

John S Young et al. J Physiol. .

Abstract

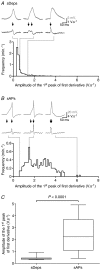
Spontaneous purinergic neurotransmission was characterized in the mouse urinary bladder, a model for the pathological or ageing human bladder. Intracellular electrophysiological recording from smooth muscle cells of the detrusor muscle revealed spontaneous depolarizations, distinguishable from spontaneous action potentials (sAPs) by their amplitude (< 40 mV) and insensitivity to the L-type Ca(2+) channel blocker nifedipine (1 microm) (100 +/- 29%). Spontaneous depolarizations were abolished by the P2X(1) receptor antagonist NF449 (10 microm) (frequency 8.5 +/- 8.5% of controls), insensitive to the muscarinic acetylcholine receptor antagonist atropine (1 microm) (103.4 +/- 3.0%), and became more frequent in latrotoxin (LTX; 1 nm) (438 +/- 95%), suggesting that they are spontaneous excitatory junction potentials (sEJPs). Such sEJPs were correlated, in amplitude and timing, with focal Ca(2+) transients in smooth muscle cells (measured using confocal microscopy), suggesting a common origin: ATP binding to P2X(1) receptors. sAPs were abolished by NF449, insensitive to atropine (126 +/- 39%) and increased in frequency by LTX (930 +/- 450%) suggesting a neurogenic, purinergic origin, in common with sEJPs. By comparing the kinetics of sAPs and sEJPs, we demonstrated that sAPs occur when sufficient cation influx through P2X(1) receptors triggers L-type Ca(2+) channels; the first peak of the differentiated rising phase of depolarizations - attributed to the influx of cations through the P2X(1) receptor - is of larger amplitude for sAPs (2248 mV s(-1)) than sEJPs (439 mV s(-1)). Surprisingly, sAPs in the mouse urinary bladder, unlike those from other species, are triggered by stochastic ATP release from parasympathetic nerve terminals rather than being myogenic.


Figures

Figure 1
Figure 1. Spontaneous depolarizations (sDeps) are purinergic in origin
A, comparing the effects of the superfusion of the P2X1 antagonist NF449 (10 μm) (a), the P2X1-desensitizing agent α,β-methylene ATP (α,β-mATP; 1 μm) (b), the muscarinic acetylcholine receptor antagonist atropine (1 μm) (c), a blocker of Na+ channels, tetrodotoxin (TTX, 1 μm) (d) and an antagonist of L-type Ca2+ channels, nifedipine (1 μm) (e) on the membrane potential of SMCs. Note the longer time-scale of Ab. A depolarization and increase in the sAP frequency induced by α,β-mATP (Ab) is initially noted (consistent with its action as an agonist), before the membrane potential returns towards its resting level and the sAPs decline in frequency (presumably as the receptors desensitize). B, a comparison of the frequency of sDeps for each drug application to normalized control frequencies, with paired t test statistical comparisons (see text for details).
Figure 2
Figure 2. Spontaneous depolarizations are neurogenic
A, α-latrotoxin (LTX; 1 nm), which serves to increase the rate of spontaneous neurotransmitter release, caused an increase in the frequency of sDeps and spontaneous action potentials (sAPs). B, similarly, the superfusion of LTX and atropine (1 μm) produced a marked increase in the frequency of sDeps and sAPs. C, superfusion of LTX in combination with NF449 (10 μm), however, abolished all depolarizations. Data shown (i.e. control, then following 15 min drug superfusion) are excerpts from continuous recordings.
Figure 3
Figure 3. Peaks in the differentiated rising phases of sAPs are of, on average, larger amplitude than the differentiated peaks of sDeps
A, sDeps (grey trace) occurred with variable rising phases. When differentiated (black trace), peaks (arrows) occurred with a positively skewed amplitude distribution. B, sAPs (grey trace), which occurred with similarly varying waveforms as sDeps, reveal two peaks (arrows) when differentiated (black trace); the amplitude of the first peak of which has a broad amplitude distribution. Data shown for A and B are from a single, long-duration recording. Bin sizes for the amplitude distributions of first derivatives are 0.125 V s−1. Note that the scale bars associated with the raw data of A and B are of differing magnitudes, and that the differentiated sAPs (B) are truncated at –1 V s−1. C, the median amplitude of the first peak of the differentiated sAP is greater than the amplitude of the differentiated sDep. Data are median, quartiles and range (n = 12). See text for details of statistical comparison.
Figure 4
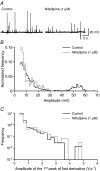
Figure 4. Blocking sAPs, through the application of nifedipine, reveals a subpopulation of sDeps with an especially rapid rising phase
A, superfusion of nifedipine (1 μm; 15 min superfusion) abolished sAPs in murine detrusor smooth muscle. A spontaneous depolarization with a following prolonged hyperpolarization was incidentally observed in the trace in the presence of nifedipine; such events were also occasionally observed in control cells (not shown) and have not been further characterized. Data shown are from a continuous recording. B, the amplitude frequency distribution post-nifedipine does not reveal a subpopulation of large amplitude sDeps; only the loss of depolarizations > 40 mV in amplitude. The threshold for detecting sEJPs was 2 mV. C, differentiated rising phases of sDeps reveal an increase in the frequency of larger amplitude events following nifedipine (1 μm) superfusion, compared to a control period.
Figure 5
Figure 5. Spontaneous focal Ca2+ transients are coincident with spontaneous depolarizations (sDeps) in mouse urinary bladder smooth muscle
A, a region of a smooth muscle cell (SMC) in a mouse isolated urinary bladder (loaded with the Ca2+ indicator Oregon Green 488 BAPTA-1 AM) during an intracellular recording. Images, acquired at 13.5 Hz, are 4 consecutive frames of a 200 frame series. A spontaneous focal Ca2+ transient occurred on frame ii (arrowhead). B, intracellular recording of a period that includes the same four frames that compose A, showing simultaneous recordings of membrane potential (black line) and whole-cell fluorescence (grey dots). C, simultaneous Ca2+ imaging and electrophysiology demonstrate the coincidence of focal Ca2+ transients and sDeps during a longer period.
Figure 6
Figure 6. Simultaneous Ca2+ imaging and electrophysiological measurement at a higher temporal resolution of imaging reveal the temporal relationship between focal Ca2+ transients and sDeps
A, a region of a smooth muscle cell (SMC) in a mouse isolated urinary bladder (loaded with the Ca2+ indicator Oregon Green 488 BAPTA-1 AM) during an intracellular recording. Line scans were taken along the long axis of an impaled SMC, the position of which is denoted by the dashed white line. B, line scan, acquired at 2 kHz, of the SMC (A) showing the occurrence of a focal Ca2+ transient (arrow). C, a measure of the Ca2+ fluorescence for a 20 μm region of the SMC in which the focal Ca2+ transient occurs (grey) compared to the membrane potential of the same cell for the same period of time (black). D, the occurrence of the focal Ca2+ transient (grey) and sDep (black) shown on an expanded time scale. The dark grey line of Ca2+ fluorescence (C and D) is a curve fitted using a custom-written script; see Methods for details.
Figure 7
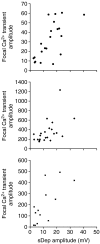
Figure 7. Focal Ca2+ transients and concurrent spontaneous depolarizations are correlated in amplitude
Correlations are shown for three recordings in which there were sufficient events to draw comparison of amplitudes.Focal Ca2+ transient amplitude =formula image, where ΔF is the change in fluorescence, Fo the resting fluorescence, and ‘area’ is the area over which the fluorescent signal is measured (in pixels) divided by 32; this is hence an arbitrary unit.

References

    1. Ambache N, Zar MA. Non-cholinergic transmission by post-ganglionic motor neurones in the mammalian bladder. J Physiol. 1970;210:761–783. - PMC - PubMed
    1. Åstrand P, Brock JA, Cunnane TC. Time course of transmitter action at the sympathetic neuroeffector junction in the rodent vascular and non-vascular smooth muscle. J Physiol. 1988;401:657–670. - PMC - PubMed
    1. Blair DH, Lin YQ, Bennett MR. Differential sensitivity to calcium and osmotic pressure of fast and slow ATP currents at sympathetic varicosities in mouse vas deferens. Auton Neurosci. 2003;105:45–52. - PubMed
    1. Brading AF, Mostwin JL. Electrical and mechanical responses of guinea-pig bladder muscle to nerve stimulation. Br J Pharmacol. 1989;98:1083–1090. - PMC - PubMed
    1. Brain KL, Cuprian AM, Williams DJ, Cunnane TC. The sources and sequestration of Ca2+ contributing to neuroeffector Ca2+ transients in the mouse vas deferens. J Physiol. 2003;553:627–635. - PMC - PubMed

Publication types

MeSH terms

Substances