. 2009 Jan;29(1):201-13.
doi: 10.1128/MCB.01349-08. Epub 2008 Oct 20.

Sam68 regulates a set of alternatively spliced exons during neurogenesis

Affiliations

Sam68 regulates a set of alternatively spliced exons during neurogenesis

Geetanjali Chawla et al. Mol Cell Biol. 2009 Jan.

Abstract

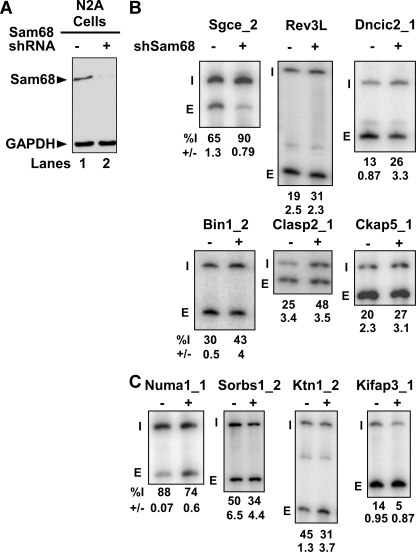
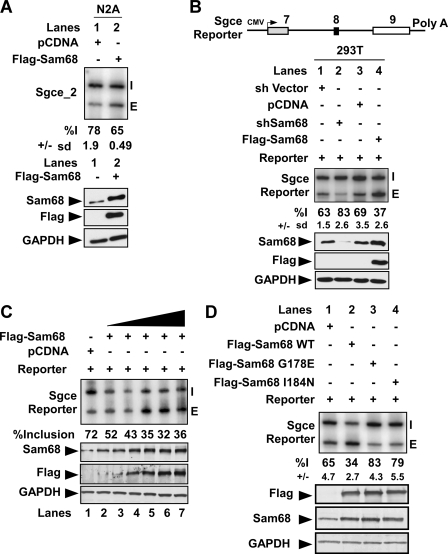
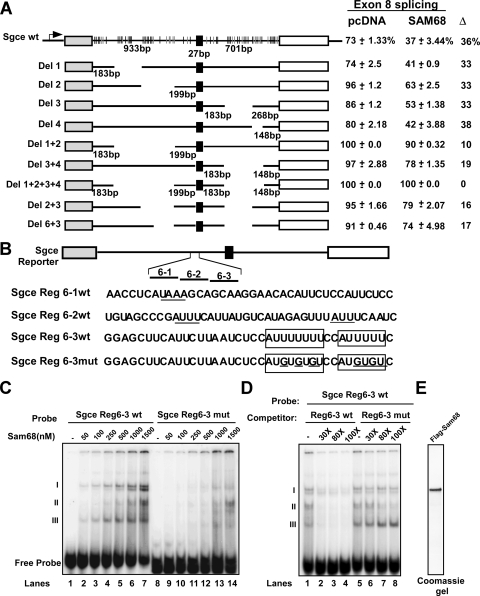
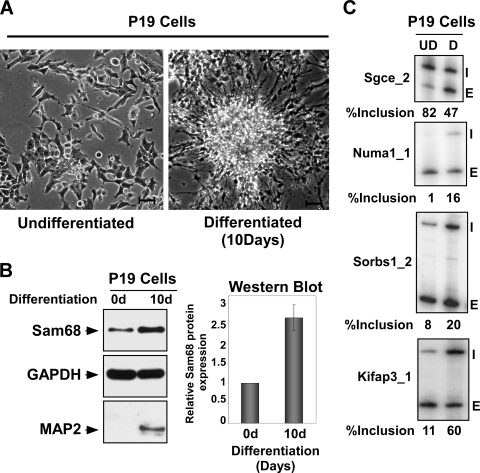
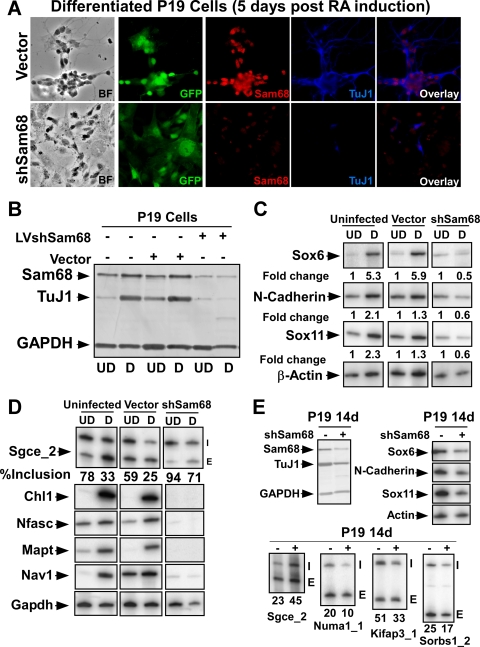
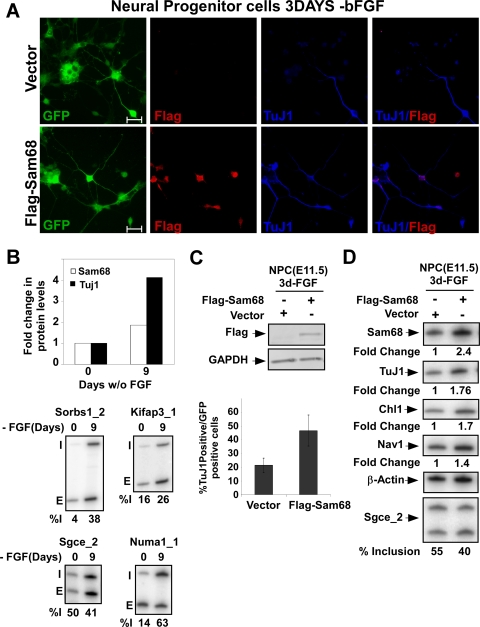
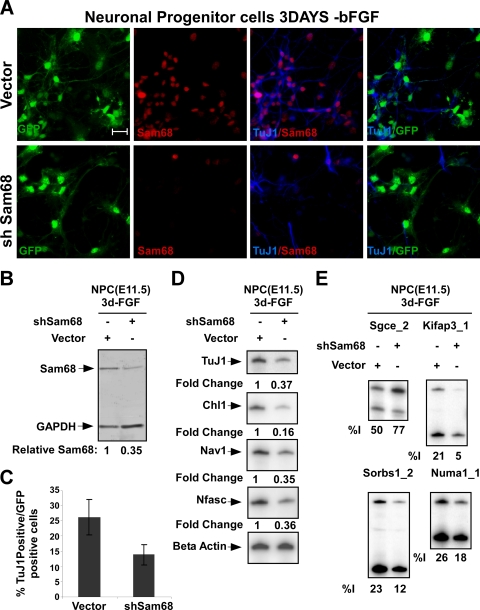
Sam68 (Src-associated in mitosis, 68 kDa) is a KH domain RNA binding protein implicated in a variety of cellular processes, including alternative pre-mRNA splicing, but its functions are not well understood. Using RNA interference knockdown of Sam68 expression and splicing-sensitive microarrays, we identified a set of alternative exons whose splicing depends on Sam68. Detailed analysis of one newly identified target exon in epsilon sarcoglycan (Sgce) showed that both RNA elements distributed across the adjacent introns and the RNA binding activity of Sam68 are necessary to repress the Sgce exon. Sam68 protein is upregulated upon neuronal differentiation of P19 cells, and many Sam68 RNA targets change in expression and splicing during this process. When Sam68 is knocked down by short hairpin RNAs, many Sam68-dependent splicing changes do not occur and P19 cells fail to differentiate. We also found that the differentiation of primary neuronal progenitor cells from embryonic mouse neocortex is suppressed by Sam68 depletion and promoted by Sam68 overexpression. Thus, Sam68 controls neurogenesis through its effects on a specific set of RNA targets.


Figures

FIG. 1.
FIG. 1.
Microarray analysis identifies new splicing targets for Sam68. (A) RNA interference against Sam68 was induced in N2A cells by using an shRNA expression vector, and empty vector was transfected as negative control. Western blot analysis was performed with Sam68 antibody and GAPDH as a loading control. (B) RT-PCR analysis of some exons repressed by Sam68. (C) RT-PCR analysis of some exons enhanced by Sam68. RT-PCR was performed with end-labeled primers in the exons flanking constitutive exons. The exon ID is indicated on the top of each panel with the percent exon inclusion (Inc) and standard deviation (n = 3) shown at the bottom of each panel. The included (I) and the skipped (E) forms are indicated on the left of each panel.
FIG. 2.
FIG. 2.
Sam68 regulates splicing of the Sgce mini gene reporter. (A) Flag-tagged Sam68 was overexpressed in the N2A cell line. RNA and protein were extracted from the cell lysates. Splicing was assayed by RT-PCR analysis using end-labeled primers against the flanking constitutive exons. The quantification of percent inclusion and standard error calculated from three separate experiments is indicated below. (Bottom panel) Western blots were probed with antibodies to detect Sam68, Flag tag, and GAPDH as a loading control. (B) Schematic diagram of the Sgce mini gene. Exons are shown as boxes and introns as lines. RT-PCR analysis of 293T cells transiently transfected with the Sgce reporter along with control plasmid (lane 1), shSam68 plasmid (lane 2), pcDNA (lane 3), or Flag-Sam68 (lane 4) results are shown. The percent inclusion with the standard deviation from three different experiments is shown below. (Bottom panel) Western blots were probed with antibodies to detect Sam68, Flag, and GAPDH as a loading control. (C) A 0.75-μg amount of the Sgce mini gene and different amounts of Flag-Sam68 (0.1 μg to 2 μg) were transfected into 293T cells. Cells were harvested after 20 h, and splicing was assayed by RT-PCR. (Bottom panel) Quantitative Western blot probed with antibodies to Sam68, Flag peptide, and GAPDH, used as a loading control. (D) RT-PCR analysis of Sgce mRNA from 293T cells transiently transfected with either wild-type Sam68 or Sam68 mutant (G178E or I184N) constructs, as indicated at the top. Cells were harvested after 24 h for isolation of RNA and protein. The percent inclusion of the Sgce reporter and the standard deviation from three different experiments is shown below. (Bottom panel) Immunoblot analysis of the expressed proteins.
FIG. 3.
FIG. 3.
Sam68 regulates Sgce alternative splicing by binding to intronic RNA repressor elements. (A) Schematic of splicing reporter constructs with exons shown as boxes and introns as lines. The UAAA (black) and the UUUA (gray) in the flanking introns are represented as vertical lines, with deletions indicated by blanks. Intron and exon lengths are indicated. Each splicing reporter was expressed in 293T cells in the absence or presence of Sam68. Cells were harvested 24 h after transfection for RNA and protein isolation. The difference in percent inclusion [inclusion/(inclusion + exclusion) × 100] between vector control (pCDNA) and Sam68 coexpression is indicated to the right. (B) Sequences of probes for regions 6-1, 6-2, and 6-3 and the Region 6-3 mutant that were used for the electrophoretic mobility shift assay. The element identified by Improbizer as enriched adjacent to Sam68 target exons is boxed; mutated residues are underlined. (C) Electrophoretic mobility shift assay results using Flag-tagged Sam68 and 32P-labeled RNA probes corresponding to region 6-3, and the region 6-3 mutant (indicated at the top). (D) In lanes 1 to 8, 500 nM of Flag-Sam68 was used. Unlabeled cold RNA was used as competitor (30-fold or 80-fold excess over the labeled probe). (E) Coomassie-stained gel of the purified Flag-Sam68.
FIG. 4.
FIG. 4.
Sam68 is upregulated upon neuronal differentiation. (A) Bright-field image of P19 cells before and after differentiation. Bar, 10 μm. (B) Protein lysates from undifferentiated and 10-day differentiated P19 cells immunoblotted for Sam68 and GAPDH as loading control. The bar graph on the right shows the induction of Sam68 protein upon differentiation. (C) Alternative splicing of Sam68 target exons as assayed by RT-PCR in undifferentiated and differentiated P19 cells. The gene names are on the left and the exon included (I) and exon skipped (E) forms are indicated on the right. The percent inclusion [I/(I + E) × 100] is shown below.
FIG. 5.
FIG. 5.
Sam68 regulates alternative splicing events during neurogenesis. (A) Immunofluorescence of Sam68 (red) and Tuj1 (blue) in P19 cells 9 days after RA treatment. Prior to differentiation, cells were infected with lentiviruses expressing shRNA to knock down Sam68 (bottom panels) or an empty vector control (top panels). Enhanced GFP (EGFP) marks the infected cells. The bright-field image, EGFP fluorescence, and staining for Sam68 (red) and TuJ1 (blue) are shown along with the Sam68/TuJ1 overlay. (B) Immunoblot analysis of lysates from undifferentiated (UD) and differentiated (D) cells. Uninfected, control virus-infected, and shSam68 lentivirus-infected cells were probed for Sam68, TuJ1, and GAPDH. (C) RT-PCR analysis of neuronal marker mRNAs from uninfected, control vector-infected, and shSam68-infected P19 cells. Expression of Sox6, Sox11, and N-cadherin was examined and the change relative to β-actin is shown below each panel. (D) RT-PCR analysis of Sam68-dependent mRNAs in uninfected, control vector-infected, and shSam68-infected P19 cells. Splicing of the Sgce exon 8 is shown in the top panel with the percent exon inclusion. The lower panel shows expression of mRNA previously found to change upon Sam68 knockdown in N2A cells. (E) P19 cells were infected with Sam68 shRNA lentivirus after differentiation (day 9). (Top left panel) Immunoblot for Sam68, TuJ1 (neuronal marker), and GAPDH in infected and uninfected cells. (Top right panel) RT-PCR for neuronal marker expression in uninfected and shSAM68-treated cells. (Bottom panel) RT-PCR analysis of target exons regulated by Sam68 in control and shSam68-treated cells.
FIG. 6.
FIG. 6.
Overexpression of Sam68 enhances neuronal differentiation of NPCs. (A) Immunostaining of Flag tag (red) and Tuj1 (blue) in NPCs infected with lentiviruses expressing Flag-Sam68 (bottom panels) or the empty vector control (top panels). Enhanced GFP (EGFP) marks the infected cells. These cells were induced to differentiate by bFGF withdrawal 2 days after transduction, and the morphology of cells was examined after 3 days. EGFP fluorescence and individual staining for Flag-Sam68 (red) and TuJ1 (blue) are shown along with the overlay of the two stains. Bar, 20 μm. (B) The bar graph at the top shows the induction of Sam68 and TuJ1 protein upon differentiation as measured by immunoblotting after 0 and 9 days. RT-PCR analysis of Sam68-dependent exons before and after neuronal differentiation of NPCs is shown at the bottom. (C, top panel) Immunoblot analysis of lysates prepared from control vector-infected and Flag-Sam68 lentivirus-infected NPCs, probed for Flag-tag and GAPDH. (C, bottom panel) Percentage of infected cells expressing the neuronal marker TuJ1 (β-tubulin III) for Flag-Sam68 virus and control virus infections. (D) RT-PCR analysis of Sam68 and TuJ1 expression in NPCs in Flag-Sam68- or control virus-infected cells. Similar analysis of Sam68 target RNAs (Chl1 and Nav1) and the splicing of Sgce_2 is shown in the lower panels; indicated below is the percent inclusion, [I/(I + E) × 100].
FIG. 7.
FIG. 7.
Sam68 knockdown in NPCs impairs neuronal differentiation. (A) Immunostaining of NPCs 5 days after lentiviral transduction and 3 days after FGF withdrawal. Expression of Sam68 (red) and Tuj1 (blue) in NPCs infected with lentivirus expressing Sam68-targeted shRNA (bottom panels) or empty vector (top panels). Enhanced GFP marking the infected cells and staining for Sam68 (red) and TuJ1 (blue) are shown along with the Sam68/TuJ1 overlay. Bar, 20 μm. (B) Immunoblot analysis of lysates from control vector- and shSam68 lentivirus-infected NPCs, probed for Sam68 and GAPDH as a loading control. (C) Graph of the percentage of infected (GFP-positive) cells that express the neuronal marker β-tubulin III (TuJ1) for shSam68 and control virus infections. (D) RT-PCR analysis of Sam68 target RNA expression (Chl1, Nav1, and Nfasc) and TuJ1 mRNA in control vector- and shSam68-infected NPCs. (E) RT-PCR analysis of Sam68 target exons in control vector- and shSam68-infected NPCs.

References

    1. Ao, W., J. Gaudet, W. J. Kent, S. Muttumu, and S. E. Mango. 2004. Environmentally induced foregut remodeling by PHA-4/FoxA and DAF-12/NHR. Science 3051743-1746. - PubMed
    1. Bailey, T. L., and C. Elkan. 1994. Fitting a mixture model by expectation maximization to discover motifs in biopolymers. Proc. Int. Conf. Intell. Syst. Mol. Biol. 228-36. - PubMed
    1. Batsche, E., M. Yaniv, and C. Muchardt. 2006. The human SWI/SNF subunit Brm is a regulator of alternative splicing. Nat. Struct. Mol. Biol. 1322-29. - PubMed
    1. Baumann, C. A., V. Ribon, M. Kanzaki, D. C. Thurmond, S. Mora, S. Shigematsu, P. E. Bickel, J. E. Pessin, and A. R. Saltiel. 2000. CAP defines a second signalling pathway required for insulin-stimulated glucose transport. Nature 407202-207. - PubMed
    1. Black, D. L. 2003. Mechanisms of alternative pre-messenger RNA splicing. Annu. Rev. Biochem. 72291-336. - PubMed

Publication types

MeSH terms

LinkOut - more resources