. 2008 Oct 27;205(11):2657-71.
doi: 10.1084/jem.20072316. Epub 2008 Oct 20.

AHI-1 interacts with BCR-ABL and modulates BCR-ABL transforming activity and imatinib response of CML stem/progenitor cells

Affiliations

AHI-1 interacts with BCR-ABL and modulates BCR-ABL transforming activity and imatinib response of CML stem/progenitor cells

Liang L Zhou et al. J Exp Med. .

Abstract

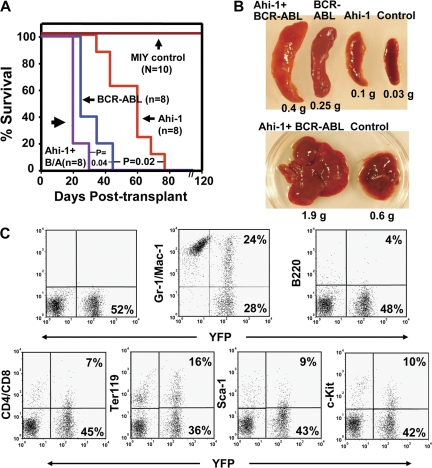
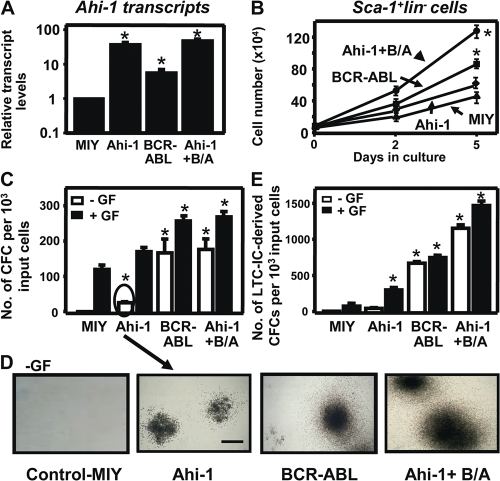
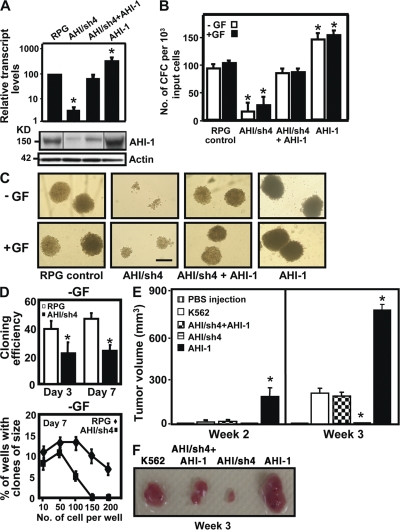
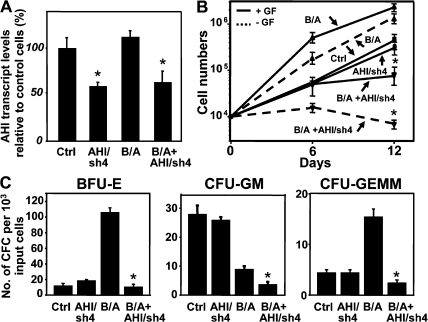
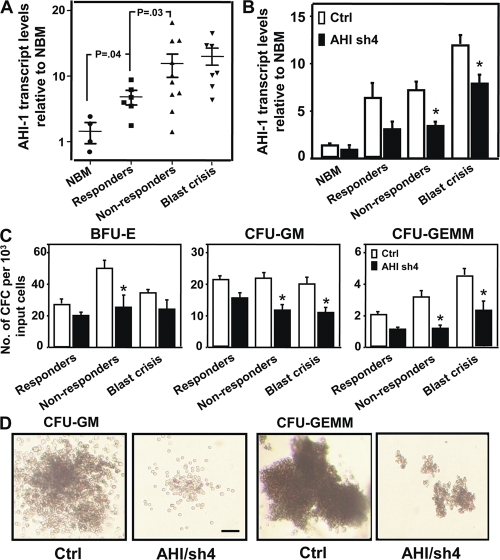
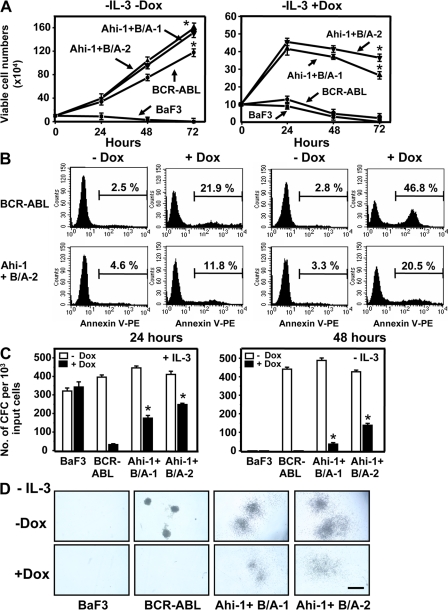
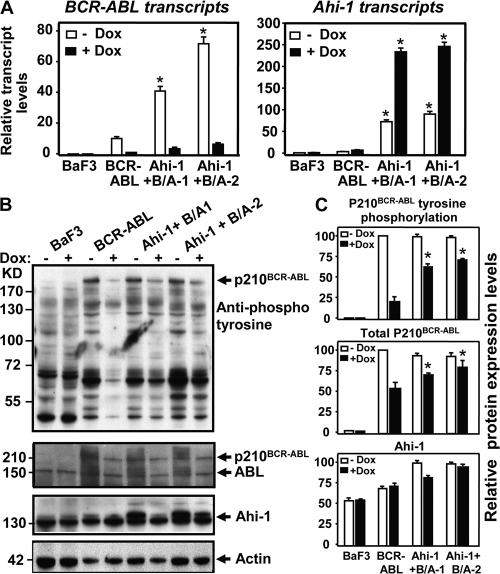
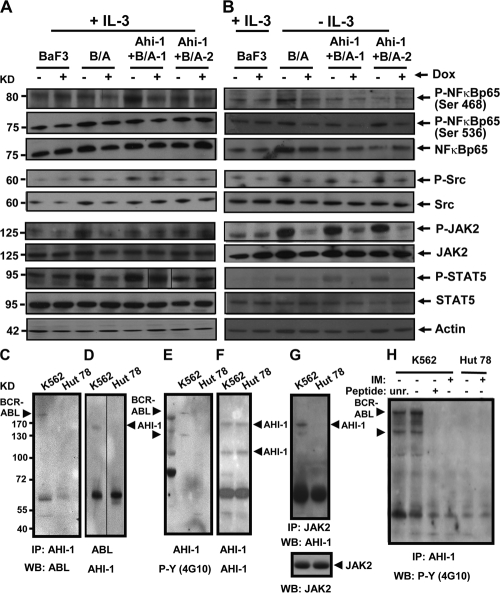
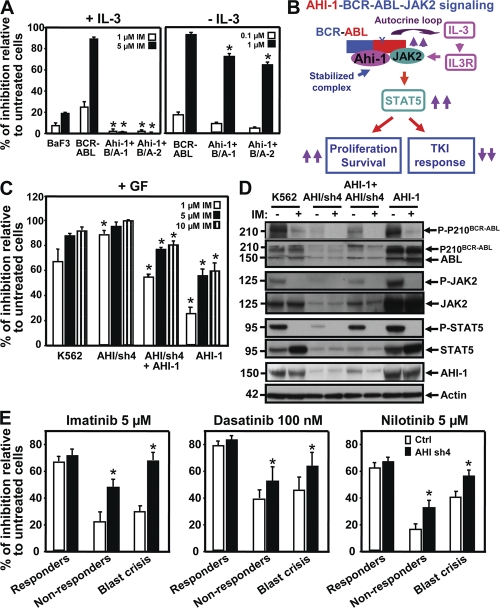
Chronic myeloid leukemia (CML) represents the first human malignancy successfully treated with a tyrosine kinase inhibitor (TKI; imatinib). However, early relapses and the emergence of imatinib-resistant disease are problematic. Evidence suggests that imatinib and other inhibitors may not effectively eradicate leukemic stem/progenitor cells, and that combination therapy directed to complimentary targets may improve treatment. Abelson helper integration site 1 (Ahi-1)/AHI-1 is a novel oncogene that is highly deregulated in CML stem/progenitor cells where levels of BCR-ABL transcripts are also elevated. Here, we demonstrate that overexpression of Ahi-1/AHI-1 in murine and human hematopoietic cells confer growth advantages in vitro and induce leukemia in vivo, enhancing effects of BCR-ABL. Conversely, RNAi-mediated suppression of AHI-1 in BCR-ABL-transduced lin(-)CD34(+) human cord blood cells and primary CML stem/progenitor cells reduces their growth autonomy in vitro. Interestingly, coexpression of Ahi-1 in BCR-ABL-inducible cells reverses growth deficiencies exhibited by BCR-ABL down-regulation and is associated with sustained phosphorylation of BCR-ABL and enhanced activation of JAK2-STAT5. Moreover, we identified an AHI-1-BCR-ABL-JAK2 interaction complex and found that modulation of AHI-1 expression regulates phosphorylation of BCR-ABL and JAK2-STAT5 in CML cells. Importantly, this complex mediates TKI response/resistance of CML stem/progenitor cells. These studies implicate AHI-1 as a potential therapeutic target downstream of BCR-ABL in CML.


Figures

Figure 1.
Figure 1.
Overexpression of Ahi-1 induces a lethal leukemia in vivo and these effects can be enhanced by cotransduction of BCR-ABL. (A) Survival curves of NOD/SCID-β2M−/− mice injected with 5 × 10⁶ BaF3 cells transduced with MIY, Ahi-1, BCR-ABL, and Ahi-1 plus BCR-ABL. 8–10 mice were used per each group. (B) Spleen (top) and liver (bottom) weight of mice injected with MIY control cells, Ahi-1–transduced cells, BCR-ABL–transduced cells, and cells cotransduced with Ahi-1 and BCR-ABL. (C) FACS profiles of YFP+ BM cells isolated from a representative moribund mouse with leukemia, after injection of Ahi-1–transduced cells and showing expression by the YFP+ cells of Gr-1/Mac-1, B220, CD4/CD8, Ter119, Sac-1, and c-kit.
Figure 2.
Figure 2.
Overexpression of Ahi-1 in Sca-1+lin mouse stem/progenitor BM cells perturbs their in vitro proliferative activity and enhances the effects of BCR-ABL. (A) The levels of Ahi-1 transcripts relative to GAPDH from FACS-purified MIY (Sca-1+linYFP+), Ahi-1 (Sca-1+linYFP+), BCR-ABL (Sca-1+linGFP+), and Ahi-1 plus BCR-ABL (Sca-1+linYFP+GFP+) transduced primary mouse BM cells. (B) Growth of each FACS-purified population with GFs. Viable cell numbers were determined by hematocytometer counts of trypan blue–excluding cells. (C) Number of CFC colonies produced in semisolid cultures ± GF from the same FACS-purified mouse BM cells. (D) The appearance of GF-independent CFC colonies is shown. Bar, 250 μm. (E) The numbers of LTC-IC–derived CFCs produced from the same cells ± GF. Values shown are the mean ± SEM of triplicate measurements. * indicates significantly different from MIY control cells.
Figure 3.
Figure 3.
Knockdown or overexpression of AHI-1 in human K562 cells mediates their transforming activity in vitro and in vivo. (A) Q-RT-PCR analysis of the levels of AHI-1 transcripts relative to GAPDH in FACS-purified RPG vector–transduced K562 cells, AHI-1/sh4 cells (with suppression of AHI-1), AHI/sh4 + AHI-1 cells (coexpression of AHI-1 in AHI-1/sh4 cells), and AHI-1 cells (AHI-1 overexpressed cells, top). Western analysis (bottom) of AHI-1 expression in the same transduced cells with an anti–AHI-1 antibody. (B) The numbers of CFC colonies produced in semisolid cultures ± GF (IL-3, GM-CSF, SF) in the same transduced cells. (C) The appearance of CFC colonies produced in semisolid cultures ± GF as shown in B. Bar, 250 μm. (D) Percentage of single control K562 cells or AHI/sh4 cells generating clones (top) and clone size distributions obtained from these cells after being cultured for 7 d (bottom). (E) NOD/SCID-β2M−/− mice were injected subcutaneously with 107 control K562 and transduced cells. Tumor volume is expressed as mean ± SEM areas of each group (n = 4). (F) The appearance of tumors generated by the same cells as shown in E. Values shown are the mean ± SEM of triplicate measurements. * indicates significantly different from K562 or RPG control cells.
Figure 4.
Figure 4.
Lentiviral-mediated suppression of AHI-1 expression causes reduced proliferative activity and GF independence of BCR-ABL–transduced human CB cells. (A) Q-RT-PCR analysis of the levels of human AHI-1 transcripts relative to GAPDH in transduced linCD34+ CB cells, including cells transduced with a control vector (Ctrl), AHI/sh4 cells (with suppression of AHI-1), BCR-ABL (B/A), and AHI/sh4 cotransduced cells (B/A + AHI/sh4). (B) Growth of each transduced population in suspension cultures ± GF for 12 d. Viable cell numbers were determined by hematocytometer counts of trypan blue-excluding cells. (C) Number of BFU-E, CFU-GM, and CFU-GEMM colonies produced in semisolid cultures from the same cells as shown in B. Values shown are the mean ± SEM of triplicate measurements. * indicates significant difference between BCR-ABL–transduced cells alone and cells cotransduced with BCR-ABL and AHI/sh4.
Figure 5.
Figure 5.
Elevated AHI-1 transcript levels in CML stem/progenitor cells and reduced CFC production in the same cells when AHI-1 expression is suppressed. (A) Q-RT-PCR analysis of the levels of human AHI-1 transcripts relative to GAPDH in linCD34+ normal bone marrow (NBM) and linCD34+ CML cells from IM responders, nonresponders, and blast crisis patients. (B) Q-RT-PCR analysis of the levels of human AHI-1 transcripts relative to GAPDH in transduced linCD34+ normal BM and CML cells (three IM responders, three nonresponders, and three blast crisis patients) ± suppression of AHI-1 expression, including cells transduced with a control vector (Ctrl) or a AHI/sh4 vector. (C) The yield of BFU-E, CFU-GM, and CFU-GEMM colonies from primary CD34+lin CML cells transduced with a control vector or AHI/sh4 vector. (D) The appearance of CFC colonies produced in semisolid cultures from control and AHI/sh4-transduced cells from an IM nonresponder patient. Bar, 100 μm. Values shown are the mean ± SEM of triplicate measurements. * indicates significant difference between transduced control cells and cells transduced with AHI/sh4 vector.
Figure 6.
Figure 6.
Overexpression of Ahi-1 rescues growth suppression induced by the inhibition of BCR-ABL expression in BCR-ABL–inducible BaF3 cells. (A) Growth of control BaF3, BCR-ABL–inducible cells, and two Ahi-1–transduced, BCR-ABL–inducible clonal lines without IL-3 ± Dox (+Dox = suppression of BCR-ABL expression). Viable cell numbers were determined by hematocytometer counts of trypan blue–excluding cells. (B) Annexin V-PE/7-AAD staining of BCR-ABL–inducible cells and Ahi-1–transduced BCR-ABL–inducible cells (Ahi-1 + B/A-2) after culture without IL-3 ± Dox for 24 and 48 h. Percentages of Annexin V+ cells are indicated. (C) CFC colonies produced in semisolid media ± IL-3 and Dox from the same cells as shown in A. (D) The appearance of GF-independent CFC colonies in Ahi-1 and BCR-ABL–cotransduced cells without IL-3 ± Dox. Bar, 250 μm. Values shown are the mean ± SEM of triplicate measurements. * indicates significant difference between BCR-ABL inducible cells alone and inducible cells cotransduced with Ahi-1.
Figure 7.
Figure 7.
Sustained tyrosine phosphorylation and protein expression of P210BCR-ABL in BCR-ABL–inducible BaF3 cells cotransduced with Ahi-1. (A) Q-RT-PCR analysis of the levels of BCR-ABL (left) and Ahi-1 (right) transcripts relative to GAPDH in control BaF3, BCR-ABL inducible cells and two Ahi-1-transduced BCR-ABL inducible clonal lines cultured without IL-3 ± Dox for 24 h. (B) Western analyses of cell lysates from the same cells for 24 h. Antibodies used are indicated. (C) Tyrosine phosphorylation and protein expression of p210BCR-ABL and Ahi-1 relative to actin, as compared with BCR-ABL–transduced cells alone. Values shown are the mean ± SEM of triplicate measurements. * indicates significant difference between BCR-ABL–inducible cells alone and the inducible cells cotransduced with Ahi-1.
Figure 8.
Figure 8.
Enhanced activation of JAK2 and STAT5 in BCR-ABL inducible BaF3 cells cotransduced with Ahi-1 and detection of a AHI-1–BCR-ABL–JAK2 interaction complex in human K562 cells. (A and B) Western blot analyses of cell lysates from control BaF3, BCR-ABL–inducible cells, and two Ahi-1–transduced BCR-ABL–inducible clonal lines cultured in the presence (A) and absence (B) of IL-3 ± Dox for 24 h. Antibodies used are indicated. (C–H) Protein lysates of K562 cells (BCR-ABL+) and Hut 78 cells (BCR-ABL) were used to immunoprecipitate AHI-1 (C, E-F, and H), ABL (D), and JAK2 (G), and proteins were detected by Western blotting with antibodies to ABL (C), AHI-1 (D, F, and G), JAK-2 (G), and phosphotyrosine (E and H) as indicated. In H, before immunoprecipitation, lysates were incubated for 1 h with the indicated AHI-1 peptide; unrelated peptide (unr.), no peptide (-), and antigenic peptide (+) or cells were incubated ± IM (5 μM) for 6 h before preparation of protein lysates.
Figure 9.
Figure 9.
AHI-1 mediates response/resistance of TKIs as assessed by overexpression or suppression of AHI-1 in BCR-ABL+ primitive CML cells. (A) Percentage of inhibition of CFC colonies generated in semisolid media ± IL-3 and IM (0–5 μM) from control BaF3, BCR-ABL–inducible cells, and two Ahi-1–transduced BCR-ABL–inducible clonal cell lines. (B) Model of AHI-1–BCR-ABL–JAK2 complex regulation of constitutive activation of BCR-ABL and JAK2–STAT5 pathway, resulting in increased proliferation and reduced TKI response of CML stem/progenitor cells. (C) Percentage of inhibition of CFC generation in semisolid media with GF and IM (0–10 μM) from control K562, AHI/sh4–transduced cells (suppression of AHI-1), overexpression of AHI-1 in AHI/sh4 cells, and AHI-1–transduced K562 cells. * indicates significantly different from K562 control cells. (D) Western analyses of cell lysates from the same cells ± IM (5 μM) for 6 h. Antibodies used are indicated. (E) Inhibition of CFCs in semisolid media with IM (5 μM), DS (100 nM), and NL (5 μM) in linCD34+ CML cells from IM responders (n = 3), nonresponders (n = 3), and blast crisis (n = 3) patient samples transduced with either a control vector or AHI-1/sh4 vector. Values shown are the mean ± SEM of triplicate measurements. * indicates significantly different between BCR-ABL–inducible cells and inducible cells cotransduced with Ahi-1, and between linCD34+ cells transduced with a control vector or transduced with the AHI-1/sh4 vector.

References

    1. Goldman, J.M., and J.V. Melo. 2003. Chronic myeloid leukemia–advances in biology and new approaches to treatment. N. Engl. J. Med. 349:1451–1464. - PubMed
    1. Jiang, X., C. Smith, A. Eaves, and C. Eaves. 2007. The challenges of targeting chronic myeloid leukemia stem cells. Clin. Lymph. Myeloma. 7:S71–S80. - PubMed
    1. Lugo, T.G., A.M. Pendergast, A.J. Muller, and O.N. Witte. 1990. Tyrosine kinase activity and transformation potency of bcr-abl oncogene products. Science. 247:1079–1082. - PubMed
    1. Druker, B.J., S. Tamura, E. Buchdunger, S. Ohno, G.M. Segal, S. Fanning, J. Zimmermann, and N.B. Lydon. 1996. Effects of a selective inhibitor of the Abl tyrosine kinase on the growth of Bcr-Abl positive cells. Nat. Med. 2:561–566. - PubMed
    1. Sattler, M., and J.D. Griffin. 2003. Molecular mechanisms of transformation by the BCR-ABL oncogene. Semin. Hematol. 40:4–10. - PubMed

Publication types

MeSH terms