Comparative Study
. 2008 Nov;249(2):493-500.
doi: 10.1148/radiol.2492080017.

k-Space and time sensitivity encoding-accelerated myocardial perfusion MR imaging at 3.0 T: comparison with 1.5 T

Affiliations
Comparative Study

k-Space and time sensitivity encoding-accelerated myocardial perfusion MR imaging at 3.0 T: comparison with 1.5 T

Sven Plein et al. Radiology. 2008 Nov.

Abstract

Purpose: To determine the feasibility and diagnostic accuracy of high-spatial-resolution myocardial perfusion magnetic resonance (MR) imaging at 3.0 T by using k-space and time (k-t) domain undersampling with sensitivity encoding (SENSE), or k-t SENSE. Data were compared with results of k-t SENSE-accelerated high-spatial-resolution perfusion MR imaging at 1.5 T and standard-resolution acquisition at 3.0 T.

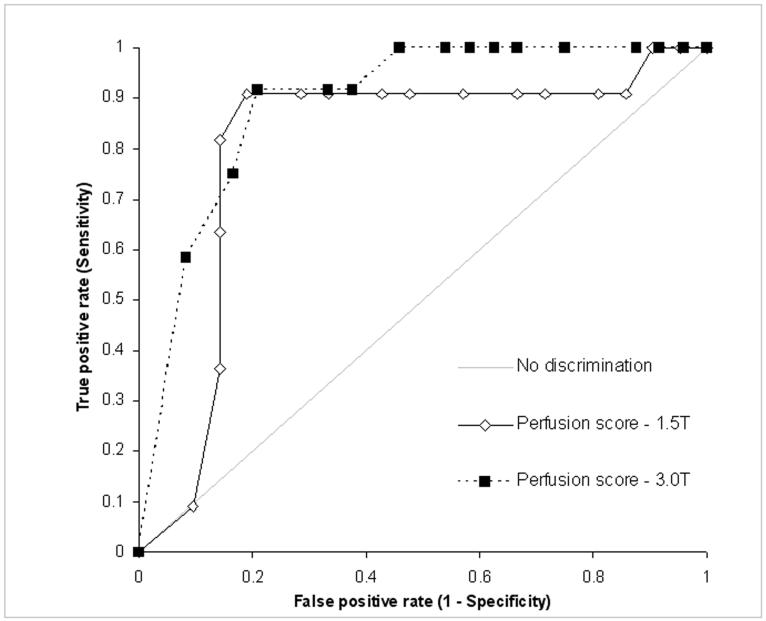
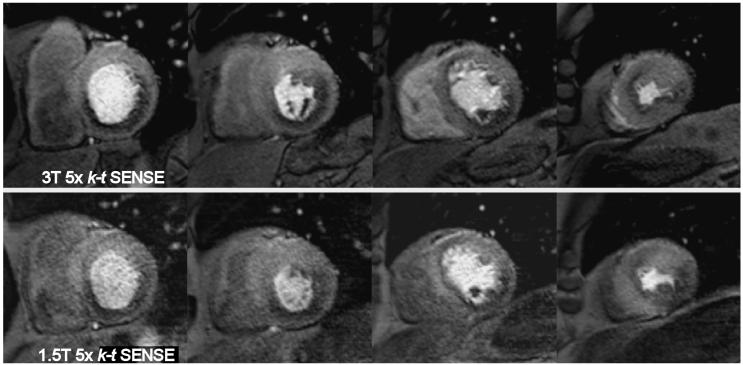
Materials and methods: The study was reviewed and approved by the local ethics review board; informed consent was obtained. k-t SENSE perfusion MR imaging was performed at 1.5 and 3.0 T (fivefold k-t SENSE acceleration; spatial resolution, 1.3 x 1.3 x 10 mm). Fourteen volunteers were studied at rest; 37 patients were studied during adenosine-induced stress. In volunteers, comparison was also made with standard-resolution (2.5 x 2.5 x 10 mm) twofold SENSE perfusion MR imaging results at 3.0 T. Image quality, artifact scores, signal-to-noise ratios (SNRs), and contrast enhancement ratios were derived. In patients, diagnostic accuracy of visual analysis to detect stenosis of more than 50% narrowing in diameter at quantitative coronary angiography was determined by using receiver operator characteristic (ROC) analysis.

Results: In volunteers, image quality and artifact scores were similar for 3.0- and 1.5-T k-t SENSE perfusion MR imaging, while SNR was higher (11.6 vs 5.6) and contrast enhancement ratio was lower (1.1 vs 1.5, P = .012) at 3.0 T. Compared with standard-resolution perfusion MR imaging, image quality was higher for 3.0-T k-t SENSE (3.6 vs 3.1, P = .04), endocardial dark rim artifacts were reduced (artifact thickness, 1.6 vs 2.4 mm, P < .001), and contrast enhancement ratios were similar. In patients, areas under the ROC curve for detection of coronary stenosis were 0.89 and 0.80 (P = .21) for 3.0 and 1.5 T, respectively.

Conclusion: k-t SENSE-accelerated high-spatial-resolution perfusion MR imaging at 3.0 T is feasible, with similar artifacts and diagnostic accuracy as those at 1.5 T. Compared with standard-resolution twofold SENSE perfusion MR imaging, image quality at k-t SENSE MR imaging is improved and artifacts are reduced.


Figures

Figure 1
Figure 1
3.0 Tesla k-t SENSE accelerated perfusion MR (3.0/1.0, flip angle, 15°) in a 26 year old healthy volunteer in the equatorial double-oblique short axis orientation. Dynamic images acquired during contrast arrival in a) the right ventricular cavity, b) the left ventricular cavity and c) the myocardium. The high image detail can be appreciated from the definition of RV trabeculation and LV papillary muscles. There is a very small rim of subendocardial dark banding artifact in the anterior wall.
Figure 2
Figure 2
Perfusion MR studies from a 32 year old healthy volunteer. One dynamic image in the equatorial double-oblique short axis orientation from each study is shown acquired during contrast arrival in the LV myocardium. a) 3.0 Tesla 2x SENSE (3.0/1.0, flip angle, 15°) accelerated perfusion-MR with a spatial resolution of 2.5 × 2.5 × 10 mm3. b) 3.0 Tesla 5x k-t SENSE accelerated perfusion-MR (3.0/1.0, flip angle, 15°) with a spatial resolution of 1.3 × 1.3 × 10 mm3. c) 1.5 Tesla 5x k-t SENSE accelerated perfusion MR (3.0/1.0, flip angle, 15°) with a spatial resolution of 1.5 × 1.5 × 10 mm3. The higher image detail in both k-t SENSE images can be appreciated. The subendocardial dark rim artefact in the septum in the k-t SENSE images appears much thinner relative to the one in the 2x SENSE image. Visually the data sets at 1.5 Tesla and 3.0 Tesla appear of similar quality.
Figure 3
Figure 3
Signal and noise maps from 5x k-t SENSE perfusion MR (3.0/1.0, flip angle, 15°) at 1.5T (left) and 3.0T (right) obtained in a 28 year old volunteer at similar cardiac levels in the equatorial double-oblique short axis orientation during contrast arrival in the myocardium. Noise maps were generated from a separate zero flip angle scan with reconstruction coefficients inherited from the signal containing, non-zero flip angle acquisition. Spatially varying noise variance is apparent. Highest noise is seen in highly dynamic areas in accordance to theory. Signal-to-noise was determined as the ratio of average absolute signal to standard deviation of the real channel of noise in the myocardial region-of-interests as indicated.
Figure 4
Figure 4
k-t SENSE accelerated adenosine stress perfusion MR studies (3.0/1.0, flip angle, 15°) in the equatorial double-oblique short axis orientation from three patients at 3.0 Tesla. a) The image graded as “excellent” quality shows a small subendocardial perfusion defect in the inferior septum. b) Image graded as “intermediate” image quality shows a perfusion defect in a similar location, but more transmural. c) Image graded as “poor” image quality still allows detection of a large infero-septal perfusion defect.
Figure 5
Figure 5
Receiver operator characteristics curve of visual analysis of perfusion MR at 3.0 Tesla and 1.5 Tesla for the detection of >50% diameter coronary artery stenosis on quantitative coronary angiography. The area under the ROC curve was 0.89 at 3.0 Tesla and 0.80 at 1.5 Tesla, p=0.21 for comparison between 3.0 and 1.5 Tesla).
Figure 6
Figure 6
3.0 and 1.5 Tesla k-t SENSE accelerated adenosine stress perfusion MR studies (3.0/1.0, flip angle, 15°) in a 65 year old patient with suspected CAD. Four sections in the double-oblique short axis orientation from base (left) to apex (right) were acquired. Both data sets have similar diagnostic content, but image quality at 3.0 Tesla is superior. The data sets show inferior and lateral ischemia in the basal and mid-cavity section and anteroseptal ischemia in the apical sections. Coronary angiography revealed three vessel disease with an occluded right coronary artery, a high-grade stenosis in the circumflex artery and sequential lesions in the left anterior descending artery.
Figure 7
Figure 7
Tesla late-gadolinium enhanced (7.5/3.8, flip angle, 15°) (a) and k-t SENSE accelerated adenosine stress perfusion MR images (3.0/1.0, flip angle, 15°) (b) from a 58 year old patient with known CAD. One short axis slice at the apical level is shown. The patient had a previous apical myocardial infarction (arrows in a) and aneurysm. The very high spatial resolution and image contrast permits the detection of peri-infarct ischemia in the apical septum (arrow in b).

Similar articles

Cited by

References

    1. Cheng AS, Pegg TJ, Karamitsos TD, Searle N, Jerosch-Herold M, Choudhury RP, Banning AP, Neubauer S, Robson MD, Selvanayagam JB. Cardiovascular magnetic resonance perfusion imaging at 3-tesla for the detection of coronary artery disease: a comparison with 1.5-tesla. J Am Coll Cardiol. 2007;49:2440–9. - PubMed
    1. Araoz PA, Glockner JF, McGee KP, et al. 3 Tesla MR imaging provides improved contrast in first-pass myocardial perfusion imaging over a range of gadolinium doses. J Cardiovasc Magn Reson. 2005;7:559–64. - PubMed
    1. Gutberlet M, Noeske R, Schwinge K, et al. Comprehensive cardiac magnetic resonance imaging at 3.0 Tesla: feasibility and implications for clinical applications. Invest Radiol. 2006;41:154–67. - PubMed
    1. Gutberlet M, Spors B, Grothoff M, et al. Comparison of different cardiac MRI sequences at 1.5 T/3.0 T with respect to signal-to-noise and contrast-to-noise ratios—initial experience. Rofo. 2004;176:801–8. - PubMed
    1. Theisen D, Wintersperger BJ, Huber A, Dietrich O, Reiser MF, Schonberg SO. Myocardial perfusion imaging with Gadobutrol: a comparison between 3 and 1.5 Tesla with an identical sequence design. Invest Radiol. 2007;42:499–506. - PubMed

Publication types

LinkOut - more resources