

Meniscal measurements of T1rho and T2 at MR imaging in healthy subjects and patients with osteoarthritis
- PMID: 18936315
- PMCID: PMC2657859
- DOI: 10.1148/radiol.2492071870
Meniscal measurements of T1rho and T2 at MR imaging in healthy subjects and patients with osteoarthritis
Abstract
Purpose: To prospectively evaluate differences in T1(rho) (T1 relaxation time in the rotating frame) and T2 values in the meniscus at magnetic resonance (MR) imaging in both patients with varying degrees of osteoarthritis (OA) and healthy control subjects.
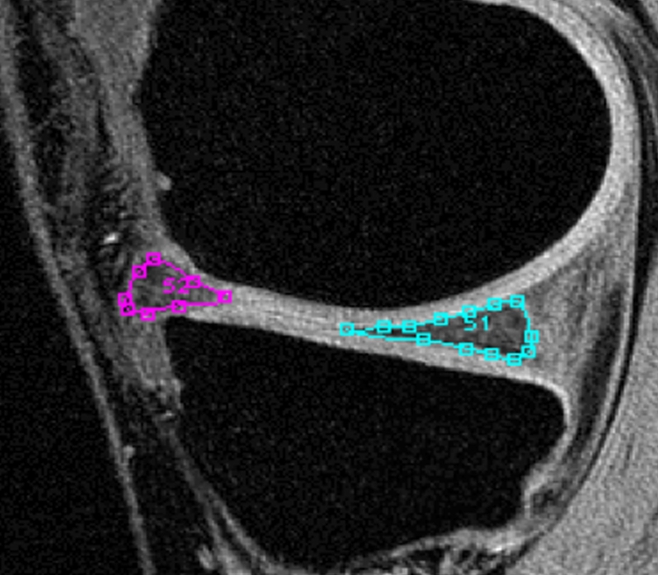
Materials and methods: The study was institutional review board approved and HIPAA compliant. Written informed consent was obtained from all subjects. T1(rho) and T2 measurements were performed at 3.0-T MR imaging in 60 subjects deemed to be healthy (n = 23; mean age, 34.1 years +/- 10.0 [standard deviation]; age range, 23-59 years), having mild OA (n = 27; mean age, 52.5 years +/- 10.9; age range, 32-69 years), or having severe OA (n = 10; mean age, 61.6 years +/- 11.6; age range, 50-86 years). Semiautomatic segmentation was performed to generate T1(rho) and T2 maps of the menisci. Clinical findings were assessed by using Western Ontario and McMaster Osteoarthritis (WOMAC) questionnaires. Differences in T1(rho) and T2 values between the three subject groups were calculated by using two-tailed t tests (with P < .05 indicating significance), and receiver operating characteristic analyses were performed. Correlations of meniscal T1(rho) and T2 values with age, cartilage-derived T1(rho) and T2 parameters, and WOMAC scores were calculated.
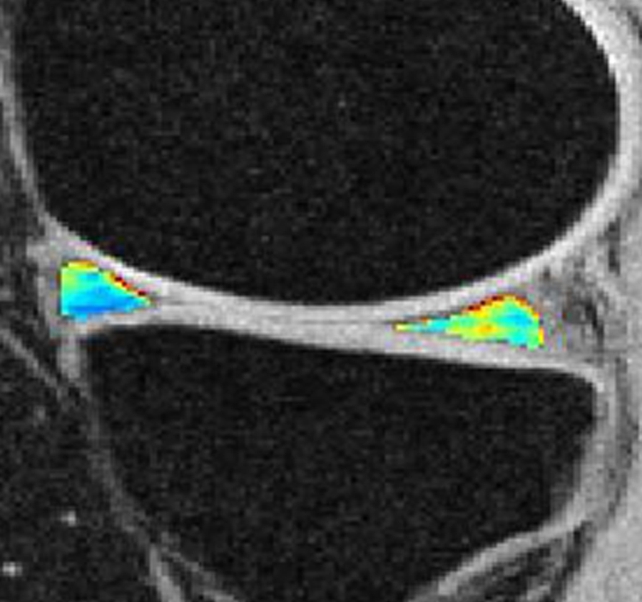
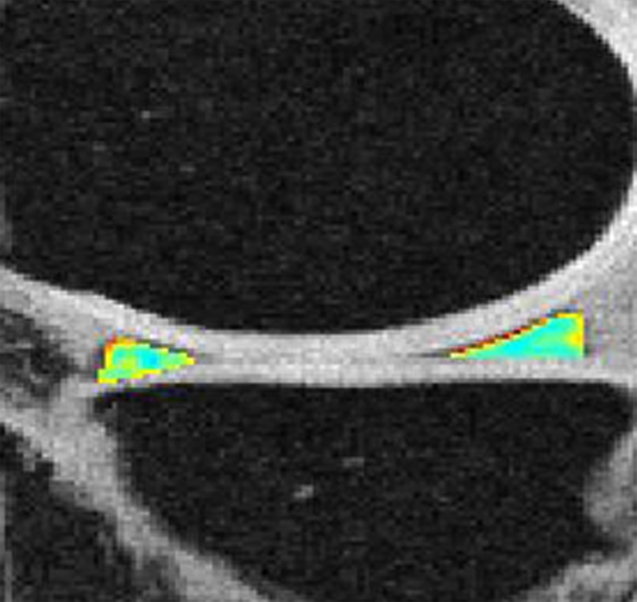
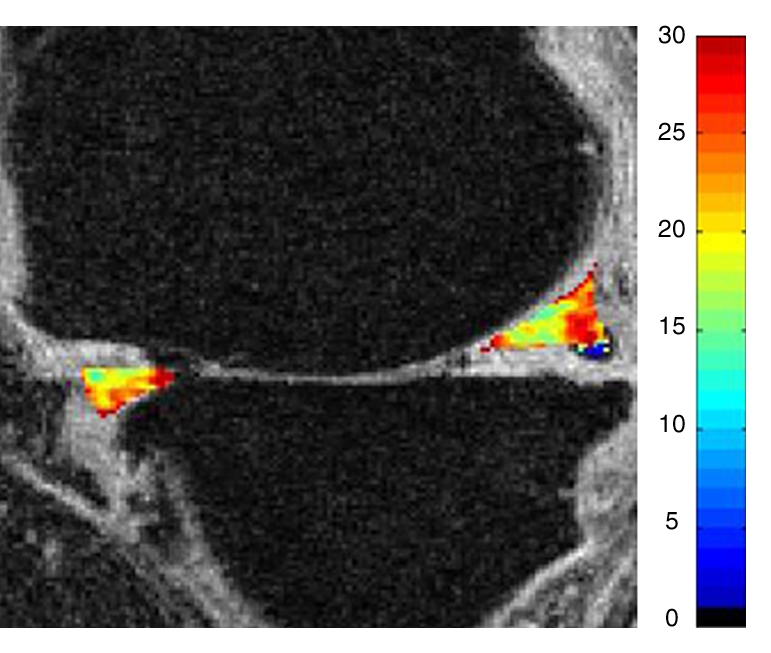
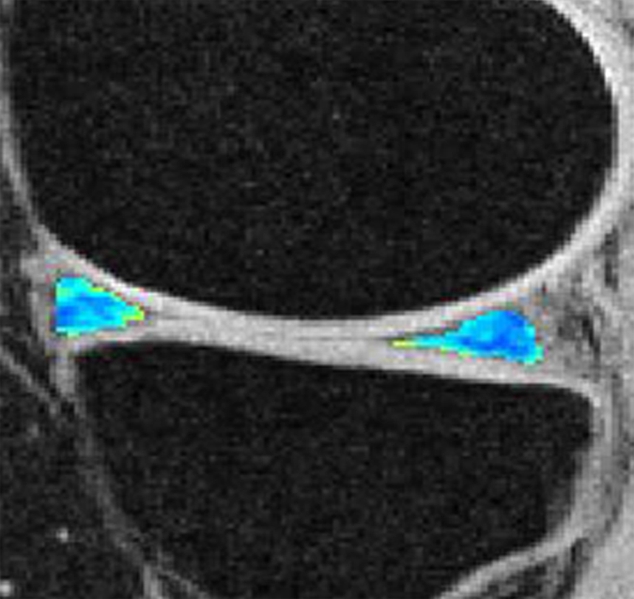
Results: Significant differences between the three subject groups were found: Mean T1(rho) values were 14.7 msec +/- 5.5, 16.1 msec +/- 6.6, and 19.3 msec +/- 7.6 for the healthy, mild OA, and severe OA groups, respectively. Mean T2 values were 11.4 msec +/- 3.9, 13.5 msec +/- 4.7, and 16.6 msec +/- 8.2 for the healthy, mild OA, and severe OA groups, respectively. Correlations of meniscal T1(rho) and T2 values with subject age (R(2) = 0.18, for correlation with T2 only), cartilage-derived parameters (R(2) = 0.14-0.29), and WOMAC scores (R(2) = 0.11-0.45) were significant.
Conclusion: Meniscal T1(rho) and T2 values correlate with clinical findings of OA and can be used to differentiate healthy subjects from patients with mild or severe OA.
(c) RSNA, 2008.
Figures
Similar articles
-
Rapid in vivo multicomponent T2 mapping of human knee menisci.J Magn Reson Imaging. 2015 Nov;42(5):1321-8. doi: 10.1002/jmri.24901. Epub 2015 Apr 2. J Magn Reson Imaging. 2015. PMID: 25847733 Free PMC article.
-
Knee articular cartilage damage in osteoarthritis: analysis of MR image biomarker reproducibility in ACRIN-PA 4001 multicenter trial.Radiology. 2011 Mar;258(3):832-42. doi: 10.1148/radiol.10101174. Epub 2011 Jan 6. Radiology. 2011. PMID: 21212364 Free PMC article.
-
T2 relaxation time of cartilage at MR imaging: comparison with severity of knee osteoarthritis.Radiology. 2004 Aug;232(2):592-8. doi: 10.1148/radiol.2322030976. Epub 2004 Jun 23. Radiology. 2004. PMID: 15215540 Free PMC article.
-
Cartilage and meniscal T2 relaxation time as non-invasive biomarker for knee osteoarthritis and cartilage repair procedures.Osteoarthritis Cartilage. 2013 Oct;21(10):1474-84. doi: 10.1016/j.joca.2013.07.012. Epub 2013 Jul 27. Osteoarthritis Cartilage. 2013. PMID: 23896316 Free PMC article. Review.
-
T2 Relaxation Times at Cardiac MRI in Healthy Adults: A Systematic Review and Meta-Analysis.Radiology. 2020 Nov;297(2):344-351. doi: 10.1148/radiol.2020200989. Epub 2020 Aug 25. Radiology. 2020. PMID: 32840469 Free PMC article.
Cited by
-
Biexponential T1ρ relaxation mapping of human knee menisci.J Magn Reson Imaging. 2019 Sep;50(3):824-835. doi: 10.1002/jmri.26631. Epub 2019 Jan 7. J Magn Reson Imaging. 2019. PMID: 30614152 Free PMC article.
-
Histological Findings and T2 Relaxation Time in Canine Menisci of Elderly Dogs-An Ex Vivo Study in Stifle Joints.Vet Sci. 2023 Feb 24;10(3):182. doi: 10.3390/vetsci10030182. Vet Sci. 2023. PMID: 36977221 Free PMC article.
-
Ex vivo quantitative multiparametric MRI mapping of human meniscus degeneration.Skeletal Radiol. 2016 Dec;45(12):1649-1660. doi: 10.1007/s00256-016-2480-x. Epub 2016 Sep 17. Skeletal Radiol. 2016. PMID: 27639388
-
Probing articular cartilage damage and disease by quantitative magnetic resonance imaging.J R Soc Interface. 2013 Jan 6;10(78):20120608. doi: 10.1098/rsif.2012.0608. J R Soc Interface. 2013. PMID: 23135247 Free PMC article. Review.
-
Regional variation in T1ρ and T2 times in osteoarthritic human menisci: correlation with mechanical properties and matrix composition.Osteoarthritis Cartilage. 2013 Jun;21(6):796-805. doi: 10.1016/j.joca.2013.03.002. Epub 2013 Mar 14. Osteoarthritis Cartilage. 2013. PMID: 23499673 Free PMC article.
References
-
- Oliveria SA, Felson DT, Reed JI, Cirillo PA, Walker AM. Incidence of symptomatic hand, hip, and knee osteoarthritis among patients in a health maintenance organization. Arthritis Rheum 1995;38:1134–1141. - PubMed
-
- Gold GE, McCauley TR, Gray ML, Disler DG. What's new in cartilage? RadioGraphics 2003;23:1227–1242. - PubMed
-
- Lang P, Noorbakhsh F, Yoshioka H. MR imaging of articular cartilage: current state and recent developments. Radiol Clin North Am 2005;43:629–639. - PubMed
-
- Link TM, Stahl R, Woertler K. Cartilage imaging: motivation, techniques, current and future significance. Eur Radiol 2007;17:1135–1146. - PubMed
-
- Recht MP, Resnick D. Magnetic resonance imaging of articular cartilage: an overview. Top Magn Reson Imaging 1998;9:328–336. - PubMed
Publication types
MeSH terms
Grants and funding
LinkOut - more resources
Full Text Sources
Other Literature Sources
Medical
