

Review
doi: 10.1097/IIO.0b013e318187e801.
Spectral domain optical coherence tomography and glaucoma
Affiliations
- PMID: 18936635
- PMCID: PMC2679587
- DOI: 10.1097/IIO.0b013e318187e801
Item in Clipboard
Review
Spectral domain optical coherence tomography and glaucoma
Int Ophthalmol Clin.
2008 Fall.
No abstract available
Figures
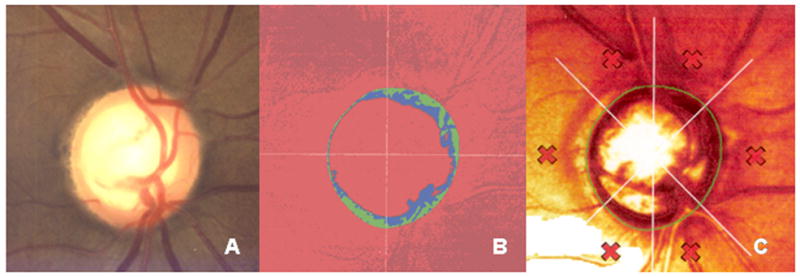
Optic nerve photograph (A) and confocal scanning laser ophthalmoscopy (Heidelberg Retina Tomograph, HRTII, Heidelberg Engineering, Germany) images (B and C) of the right eye of a 52-year-old white man with physiologic cupping.
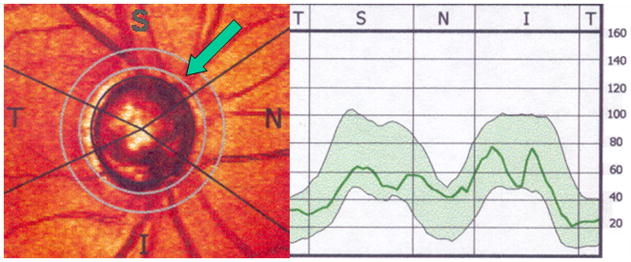
Retinal nerve fiber layer (RNFL) thickness determined by scanning laser polarimetry (GDxVCC). The RNFL thickness within the “calculation circle” (green arrow) is displayed graphically on the right.
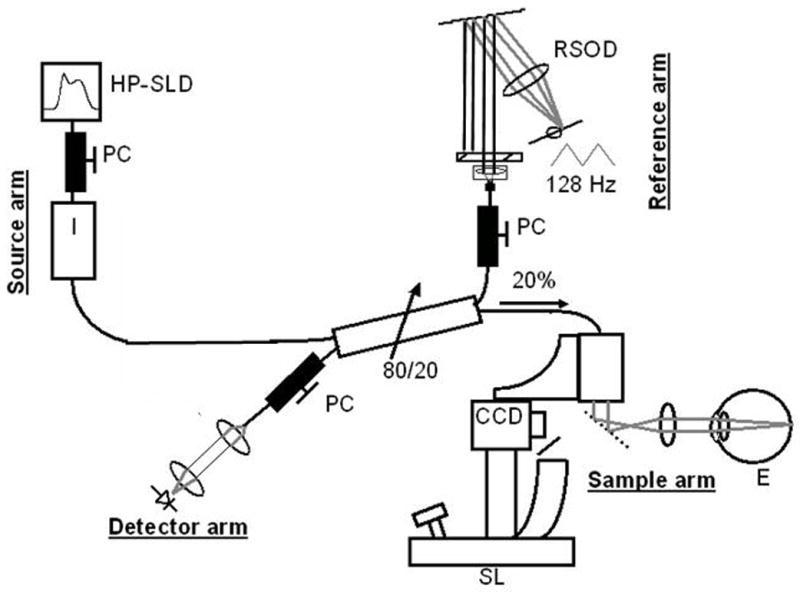
Time domain optical coherence tomography (TDOCT) set-up. CCD indicates charge-coupled device camera; E, eye; HP-SLD, high-power superlumninescent diode;PC, polarization controller; RSOD, rapid scanning optical delay line; SL, slit lamp.
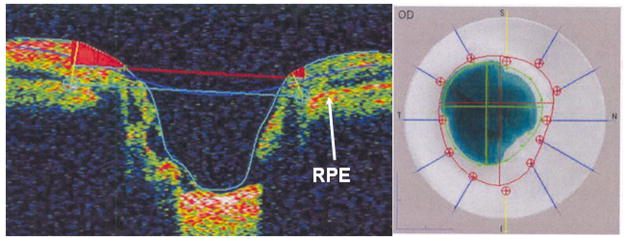
Time domain optical coherence tomography (Stratus OCT3, Carl Zeiss Meditec Inc, Dublin, CA) imaging of the right optic nerve of a 52-year-old white man with physiologic cupping. Left image, This is the vertical cross-section through the optic nerve head. The reference plane (upper horizontal line) 150 μm above the retinal pigment epithelium (RPE) divides the neuroretinal rim above from the cup below. Right image, The cup is delimited by the inner circle and the disc border by the outer dotted circle.
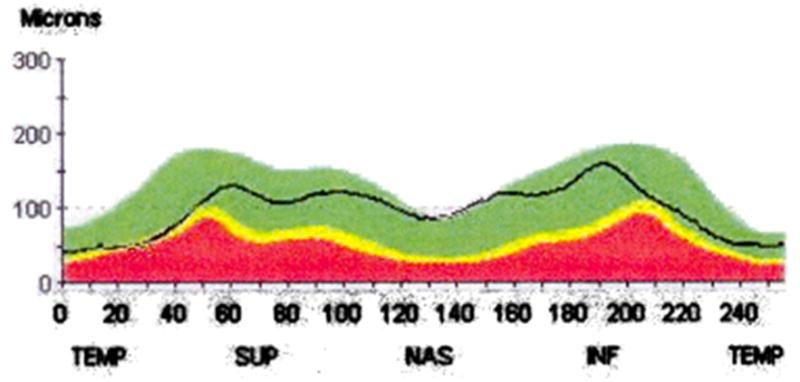
Time domain optical coherence tomography (Stratus OCT3, Carl Zeiss Meditec Inc, Dublin, CA) retinal nerve fiber layer (RNFL) thickness graph of the right optic nerve of a 52-year-old white man with physiologic cupping. RNFL thickness values are obtained from a 3.46 circular scan centered around the optic nerve head. Temporal (TEMP), superior (SUP), nasal (NAS), and inferior (INF) represent the area of RNFL relative to the optic nerve head.
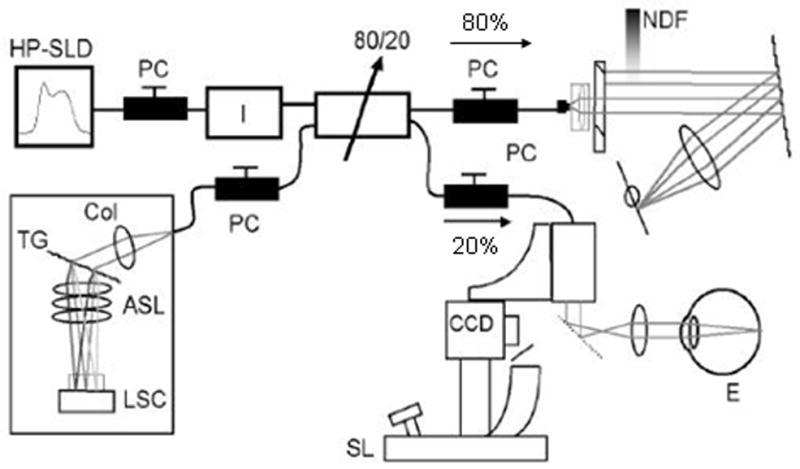
Spectral domain optical coherence tomography (SDOCT) set-up. ASL indicates air-spaced focusing lens; CCD, charge-coupled device camera; Col, collimator; E, eye; HP-SLD, high-power superluminescent diode; LSC, linescan camera; NDF, neutral density filter; PC, polarization controller; SL, slit lamp; TG, transmission grating.
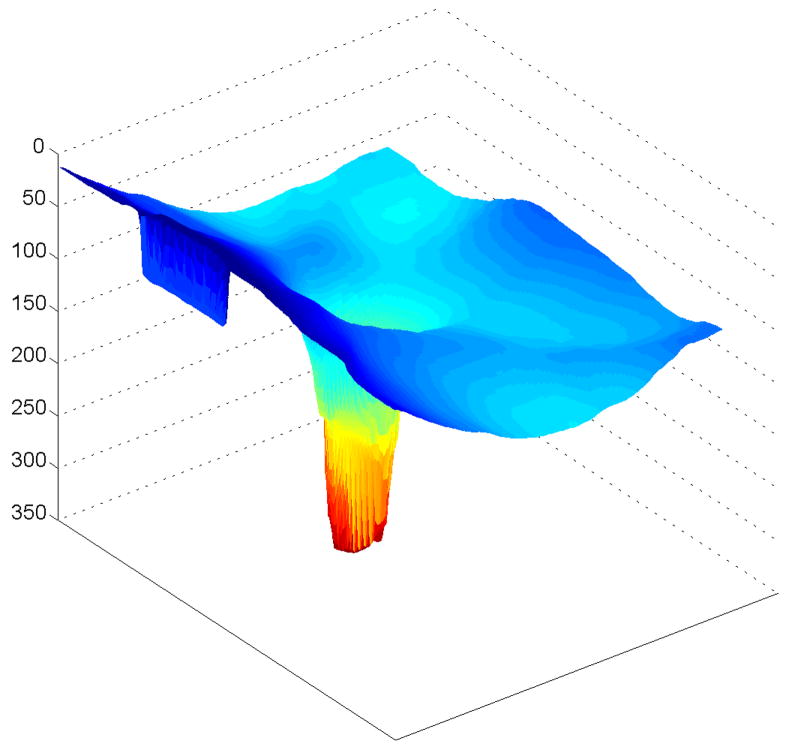
Spectral domain optical coherence tomography (SDOCT) 3-dimensional image of the normal left eye of a 38-year-old Korean woman. The image is elongated 4 times. The image was scanned with a prototype SDOCT system with a superluminescent diode laser (SLD, Superlum, Moscow, Russia) with a full width at half-maximum spectral width of 50 nm centered at 840 nm and with a resolution of 6 μm.
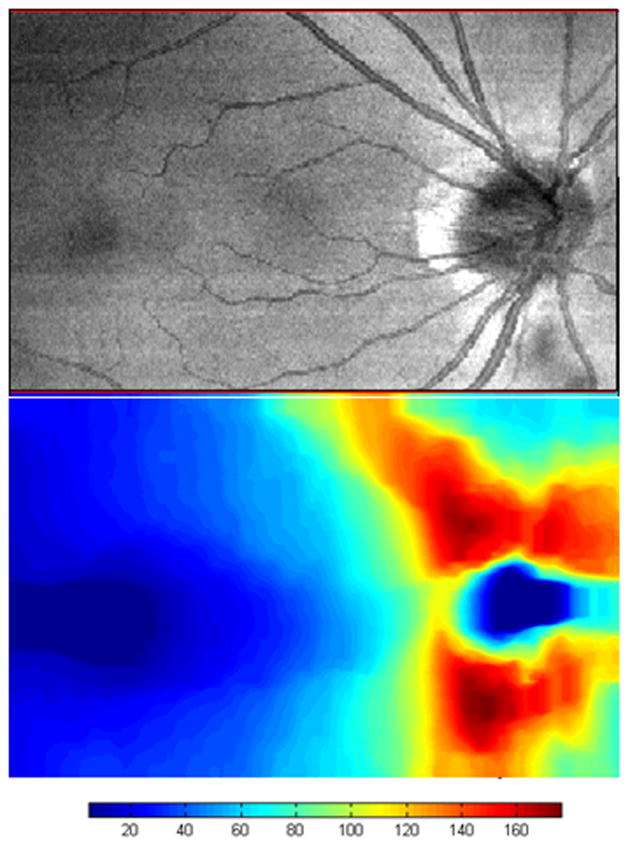
Spectral domain optical coherence tomography (SDOCT) integrated reflectance image (top) and retinal nerve fiber layer thickness map (bottom) of the normal right eye of a 43-year-old white man. The image was scanned with a prototype SDOCT system with a titanium:sapphire laser (Femtolaser, Austria) with a central wavelength of 800 nm and a full width at half-maximum spectral bandwidth of about 140 nm with a 2.8-μm axial resolution. The scale is in microns. The foveal area is on the left, and the normal bowtie retinal nerve fiber layer thickness pattern is shown around the optic nerve head on the right. The area scanned is 8.85×5.73 mm.
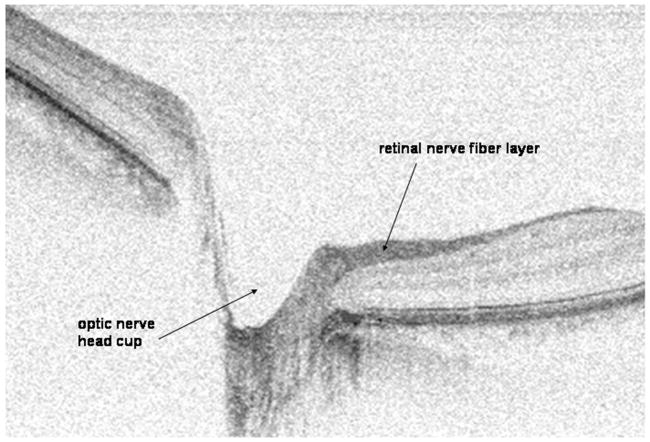
Spectral domain optical coherence tomography (SDOCT) image of the normal right optic nerve of a 43-year-old white man. The image was scanned with a prototype SDOCT system with a titanium:sapphire laser (Femtolaser, Austria) with a central wavelength of 800 nm and a full width at half-maximum spectral bandwidth of about 140 nm with a 2.8-μm axial resolution. The image is elongated 2 times.
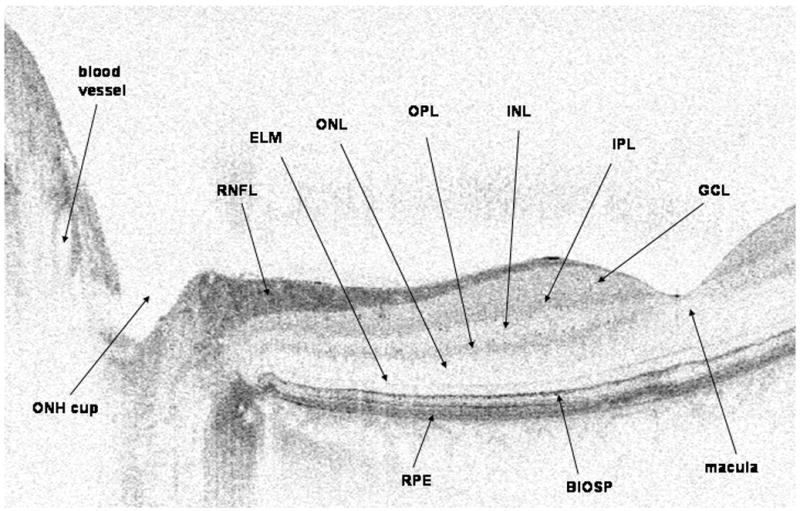
Spectral domain optical coherence tomography (SDOCT) image of the normal right optic nerve and fovea of a 43-year-old white man. The image was scanned with a prototype SDOCT system with a titanium:sapphire laser (Femtolaser, Austria) with a central wavelength of 800 nm and a full width at half-maximum spectral bandwidth of about 140 nm with a 2.8-μm axial resolution. The image is elongated 2 times. BIOSP indicates boundary between the inner and outer segments of the photoreceptors; ELM, external limiting membrane; GCL, ganglion cell layer; INL, inner nuclear layer; IPL, inner plexiform layer; ONH, optic nerve head; ONL, outer nuclear layer; OPL, outer plexiform layer; RNFL, retinal nerve fiber layer; RPE, retinal pigment epithelium.
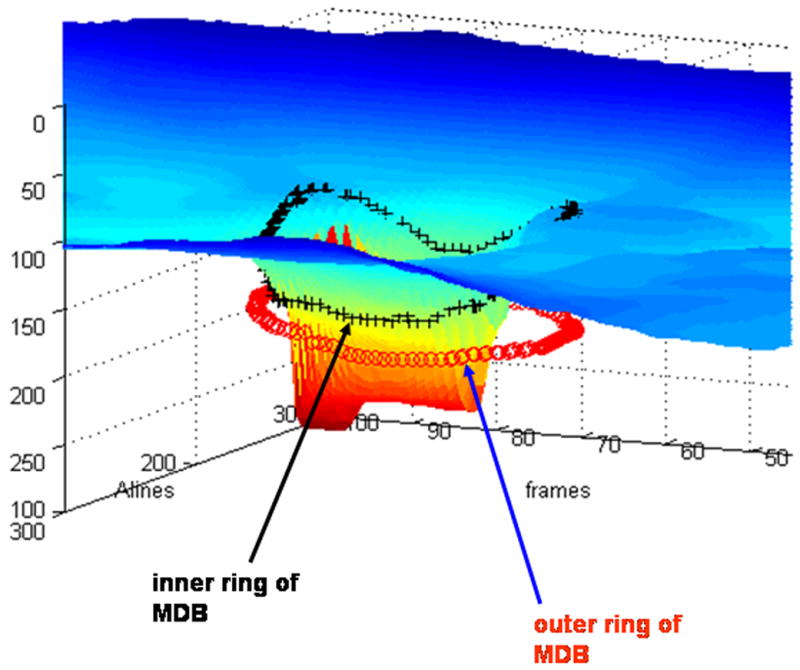
Method for “minimum distance band” (MDB) determination in spectral domain optical coherence tomography (SDOCT) images of the optic nerve head. The inner ring of the MDB is shown by the black crosses and correspond to the optic nerve head surface. The outer ring of the MDB is shown by the tiny circles and correspond to the edge of the retinal pigment epithelium. The image was scanned with a prototype SDOCT system with a superluminescent diode laser (SLD, Superlum, Moscow, Russia) with a full width at half-maximum spectral width of 50 nm centered at 840 nm and with a resolution of 6 μm.
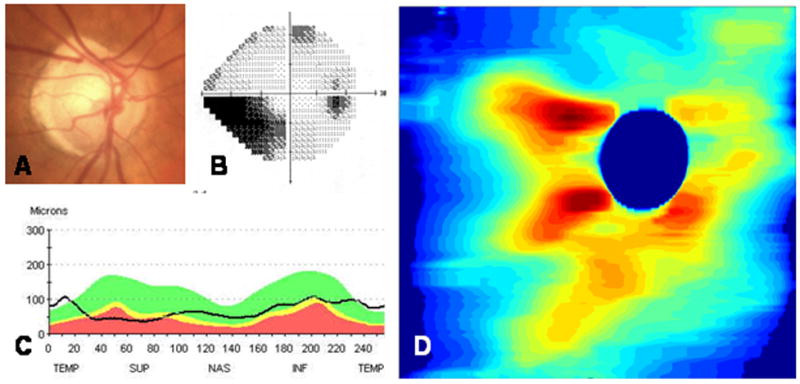
The right eye of a 77-year-old white woman was found to have mixed mechanism glaucoma. Her fundus photograph (A) showed superior neuroretinal rim thinning that corresponds to an inferior nasal step (B) on Humphrey visual field testing (24-2). From the Stratus OCT3 (Carl Zeiss Meditec Inc, Dublin, CA), retinal nerve fiber layer (RNFL) thinning was greater superiorly than inferiorly (C). Spectral domain optical coherence tomography (SDOCT) RNFL thickness map displays the entire peripapillary RNFL thickness (D), with greater RNFL thinning superiorly than inferiorly. The image was scanned with a prototype SDOCT system using a superluminescent diode laser (SLD, Superlum, Moscow, Russia) with a full width at half-maximum spectral width of 50 nm centered at 840 nm and with a resolution of 6 μm.
References
-
- The International Bank for Reconstruction and Development—The World Bank. WorldAQ3 Development Report. Oxford: Oxford University Press; 1993.
-
- Dielemans I, Vingerling JR, Wolfs RC, et al. The prevalence of primary open-angle glaucoma in a population-based study in the Netherlands. The Rotterdam Study. Ophthalmology. 1994;101:1851–1855. - PubMed
-
- Leske MC, Connell AM, Schachat AP, et al. The Barbados Eye Study. Prevelance of open angle glaucoma. Arch Ophthalmol. 1994;112:821–829. - PubMed
-
- Mitchell P, Smith W, Attebo K, et al. Prevalence of open-angle glaucoma in Australia. The Blue Mountains Eye Study. Ophthalmology. 1996;103:1661–1669. - PubMed
Publication types
MeSH terms
Grants and funding
LinkOut - more resources
Full Text Sources
Other Literature Sources
Medical
