

Structural and functional characterization of the c-terminal domain of the ecdysteroid phosphate phosphatase from bombyx mori reveals a new enzymatic activity
- PMID: 18937503
- PMCID: PMC2722925
- DOI: 10.1021/bi801318w
Structural and functional characterization of the c-terminal domain of the ecdysteroid phosphate phosphatase from bombyx mori reveals a new enzymatic activity
Abstract
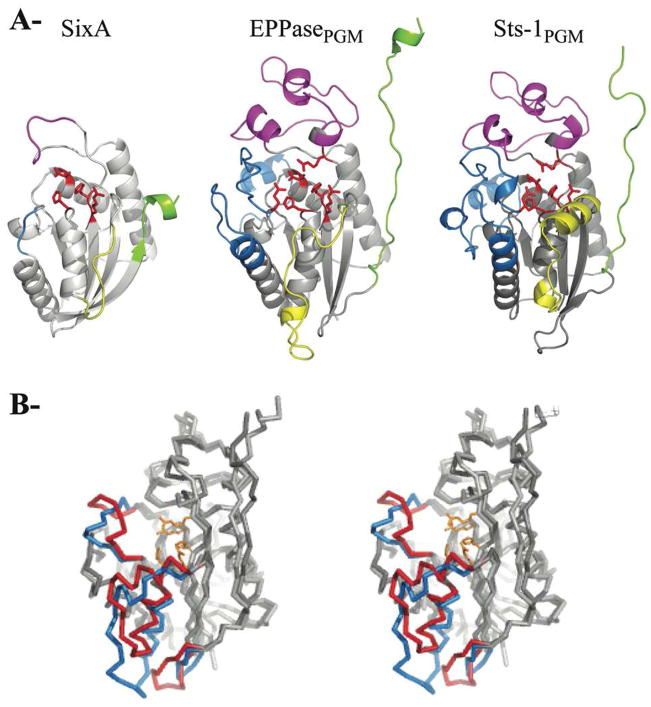
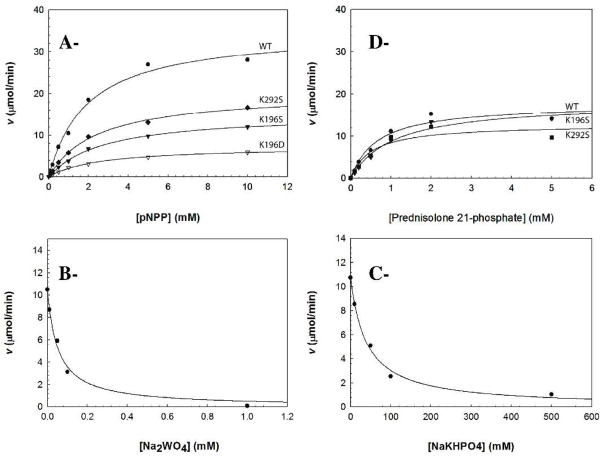
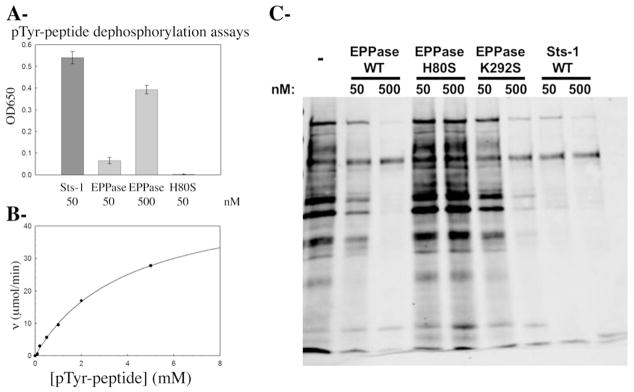
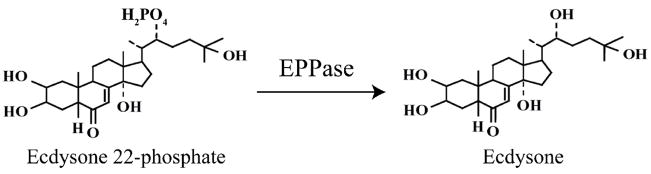
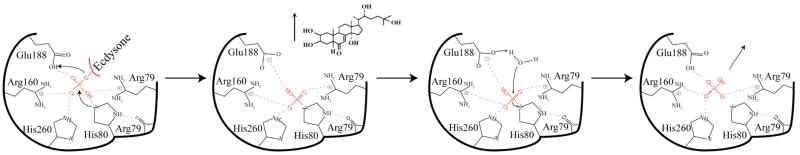
Here, we present the crystal structure of the ecdysone phosphate phosphatase (EPPase) phosphoglycerate mutase (PGM) homology domain, the first structure of a steroid phosphate phosphatase. The structure reveals an alpha/beta-fold common to members of the two histidine (2H)-phosphatase superfamily with strong homology to the Suppressor of T-cell receptor signaling-1 (Sts-1 PGM) protein. The putative EPPase PGM active site contains signature residues shared by 2H-phosphatase enzymes, including a conserved histidine (His80) that acts as a nucleophile during catalysis. The physiological substrate ecdysone 22-phosphate was modeled in a hydrophobic cavity close to the phosphate-binding site. EPPase PGM shows limited substrate specificity with an ability to hydrolyze steroid phosphates, the phospho-tyrosine (pTyr) substrate analogue para-nitrophenylphosphate ( pNPP) and pTyr-containing peptides and proteins. Altogether, our data demonstrate a new protein tyrosine phosphatase (PTP) activity for EPPase. They suggest that EPPase and its closest homologues can be grouped into a distinct subfamily in the large 2H-phosphatase superfamily of proteins.
Figures


Similar articles
-
An unsuspected ecdysteroid/steroid phosphatase activity in the key T-cell regulator, Sts-1: surprising relationship to insect ecdysteroid phosphate phosphatase.Proteins. 2007 May 15;67(3):720-31. doi: 10.1002/prot.21357. Proteins. 2007. PMID: 17348005
-
Structural and functional characterization of the 2H-phosphatase domain of Sts-2 reveals an acid-dependent phosphatase activity.Biochemistry. 2009 Mar 3;48(8):1681-90. doi: 10.1021/bi802219n. Biochemistry. 2009. PMID: 19196006 Free PMC article.
-
Ecdysteroids during early embryonic development in silkworm Bombyx mori: metabolism and functions.Zoolog Sci. 2004 May;21(5):503-16. doi: 10.2108/zsj.21.503. Zoolog Sci. 2004. PMID: 15170054 Review.
-
Purification, kinetic characterization, and molecular cloning of a novel enzyme ecdysteroid-phosphate phosphatase.J Biol Chem. 2003 Jul 18;278(29):26365-73. doi: 10.1074/jbc.M304158200. Epub 2003 Apr 29. J Biol Chem. 2003. PMID: 12721294
-
Mechanistic studies on protein tyrosine phosphatases.Prog Nucleic Acid Res Mol Biol. 2003;73:171-220. doi: 10.1016/s0079-6603(03)01006-7. Prog Nucleic Acid Res Mol Biol. 2003. PMID: 12882518 Review.
Cited by
-
TULA-family proteins: an odd couple.Cell Mol Life Sci. 2009 Sep;66(17):2949-52. doi: 10.1007/s00018-009-0071-x. Epub 2009 Jul 8. Cell Mol Life Sci. 2009. PMID: 19585081 Free PMC article. Review.
-
Ensembles generated from crystal structures of single distant homologues solve challenging molecular-replacement cases in AMPLE.Acta Crystallogr D Struct Biol. 2018 Mar 1;74(Pt 3):183-193. doi: 10.1107/S2059798318002310. Epub 2018 Mar 2. Acta Crystallogr D Struct Biol. 2018. PMID: 29533226 Free PMC article.
-
Tungstate as a Transition State Analog for Catalysis by Alkaline Phosphatase.J Mol Biol. 2016 Jul 3;428(13):2758-68. doi: 10.1016/j.jmb.2016.05.007. Epub 2016 May 14. J Mol Biol. 2016. PMID: 27189921 Free PMC article.
-
TULA Proteins in Men, Mice, Hens, and Lice: Welcome to the Family.Int J Mol Sci. 2023 May 23;24(11):9126. doi: 10.3390/ijms24119126. Int J Mol Sci. 2023. PMID: 37298079 Free PMC article. Review.
-
Structural and Functional Characterization of the Histidine Phosphatase Domains of Human Sts-1 and Sts-2.Biochemistry. 2017 Sep 5;56(35):4637-4645. doi: 10.1021/acs.biochem.7b00638. Epub 2017 Aug 21. Biochemistry. 2017. PMID: 28759203 Free PMC article.
References
-
- Gelman DB, Pszczolkowski MA, Blackburn MB, Ramaswamy SB. Ecdysteroids and juvenile hormones of whiteflies, important insect vectors for plant viruses. J Insect Physiol. 2007;53:274–284. - PubMed
-
- Mirth CK, Riddiford LM. Size assessment and growth control: how adult size is determined in insects. Bioessays. 2007;29:344–355. - PubMed
-
- Yin VP, Thummel CS. Mechanisms of steroid-triggered programmed cell death in Drosophila. Semin Cell Dev Biol. 2005;16:237–243. - PubMed
-
- Dubrovsky EB. Hormonal cross talk in insect development. Trends Endocrinol Metab. 2005;16:6–11. - PubMed
-
- Sonobe H, Yamada R. Ecdysteroids during early embryonic development in silkworm Bombyx mori: metabolism and functions. Zoolog Sci. 2004;21:503–516. - PubMed
Publication types
MeSH terms
Substances
Grants and funding
LinkOut - more resources
Full Text Sources
Molecular Biology Databases
