. 2009 Feb 15;418(1):29-37.
doi: 10.1042/BJ20081258.

Increased levels of superoxide and H2O2 mediate the differential susceptibility of cancer cells versus normal cells to glucose deprivation

Affiliations

Increased levels of superoxide and H2O2 mediate the differential susceptibility of cancer cells versus normal cells to glucose deprivation

Nùkhet Aykin-Burns et al. Biochem J. .

Abstract

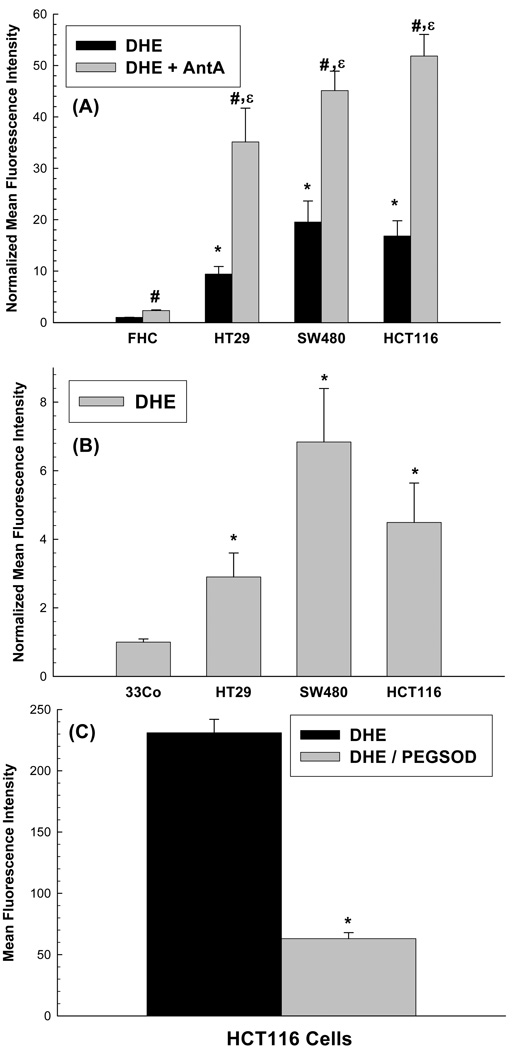
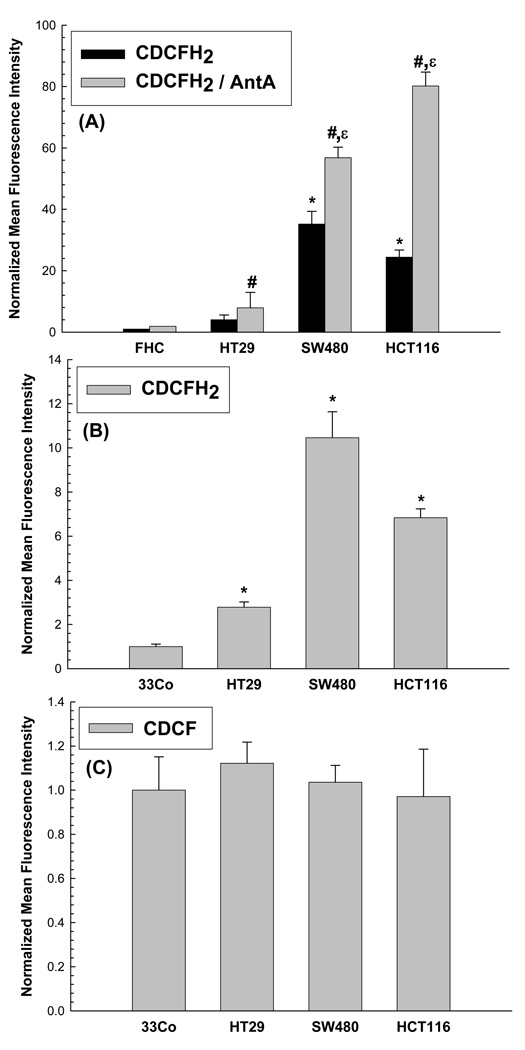
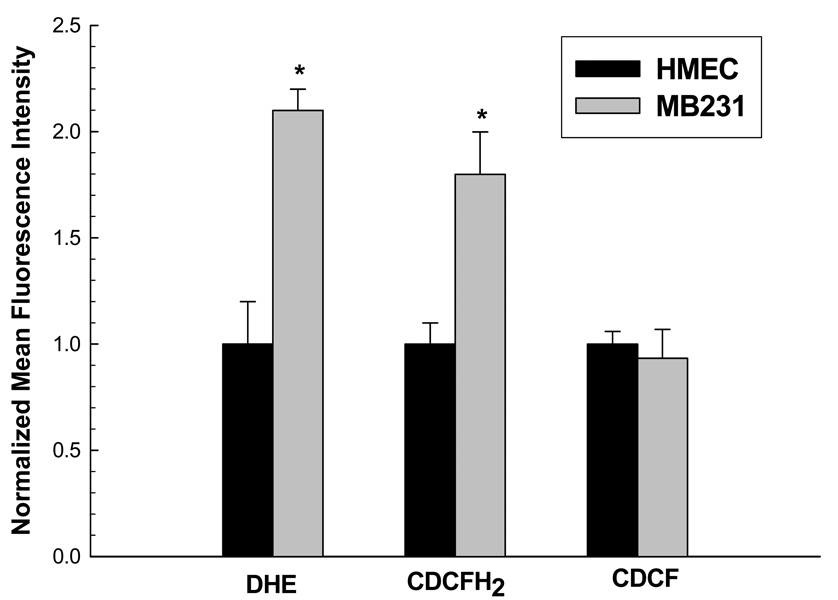
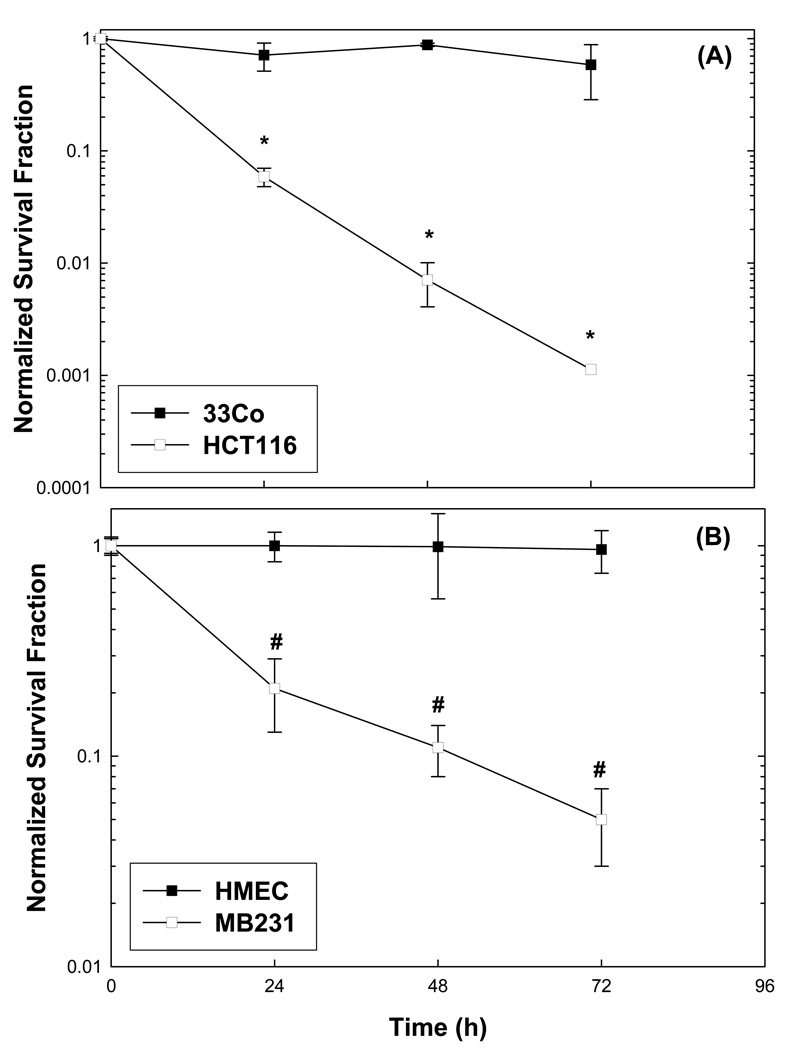
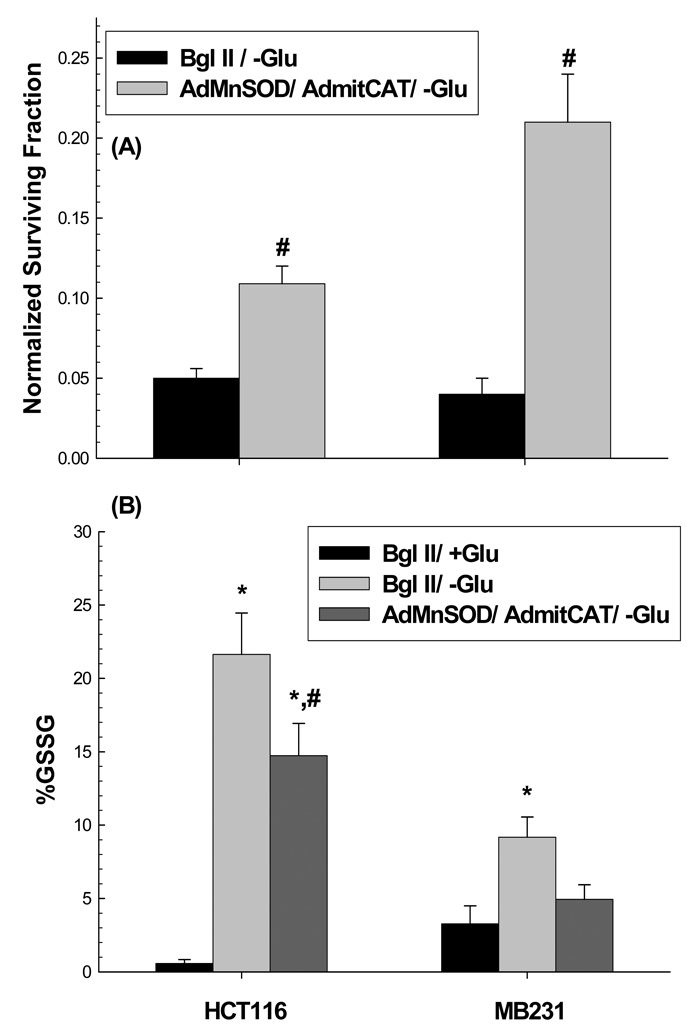
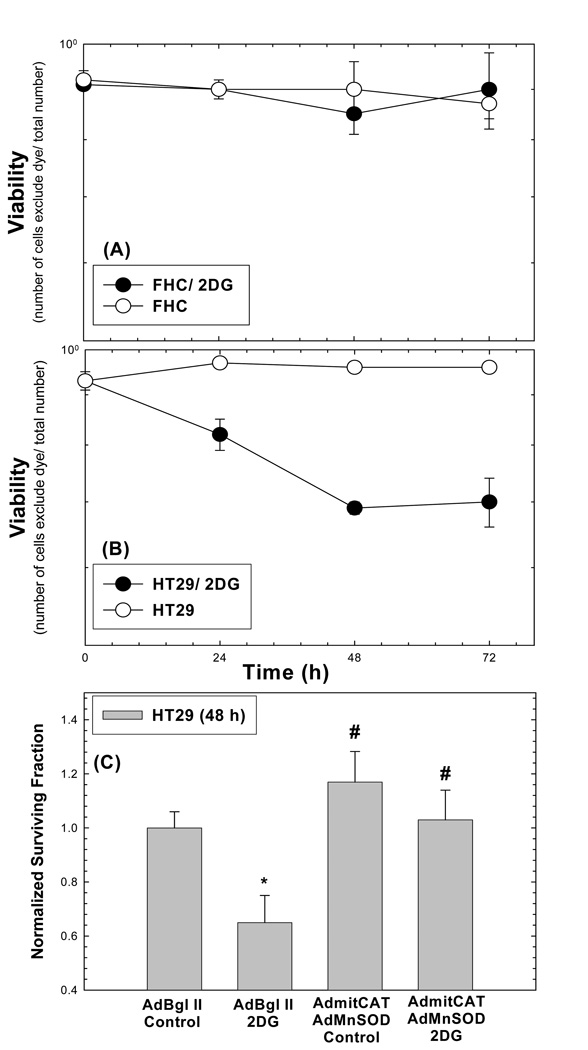
Cancer cells, relative to normal cells, demonstrate increased sensitivity to glucose-deprivation-induced cytotoxicity. To determine whether oxidative stress mediated by O(2)(*-) and hydroperoxides contributed to the differential susceptibility of human epithelial cancer cells to glucose deprivation, the oxidation of DHE (dihydroethidine; for O(2)(*-)) and CDCFH(2) [5- (and 6-)carboxy-2',7'-dichlorodihydrofluorescein diacetate; for hydroperoxides] was measured in human colon and breast cancer cells (HT29, HCT116, SW480 and MB231) and compared with that in normal human cells [FHC cells, 33Co cells and HMECs (human mammary epithelial cells)]. Cancer cells showed significant increases in DHE (2-20-fold) and CDCFH(2) (1.8-10-fold) oxidation, relative to normal cells, that were more pronounced in the presence of the mitochondrial electron-transport-chain blocker, antimycin A. Furthermore, HCT116 and MB231 cells were more susceptible to glucose-deprivation-induced cytotoxicity and oxidative stress, relative to 33Co cells and HMECs. HT29 cells were also more susceptible to 2DG (2-deoxyglucose)-induced cytotoxicity, relative to FHC cells. Overexpression of manganese SOD (superoxide dismutase) and mitochondrially targeted catalase significantly protected HCT116 and MB231 cells from glucose-deprivation-induced cytotoxicity and oxidative stress and also protected HT29 cells from 2DG-induced cytotoxicity. These results show that cancer cells (relative to normal cells) demonstrate increased steady-state levels of ROS (reactive oxygen species; i.e. O(2)(*-) and H(2)O(2)) that contribute to differential susceptibility to glucose-deprivation-induced cytotoxicity and oxidative stress. These studies support the hypotheses that cancer cells increase glucose metabolism to compensate for excess metabolic production of ROS and that inhibition of glucose and hydroperoxide metabolism may provide a biochemical target for selectively enhancing cytotoxicity and oxidative stress in human cancer cells.


Figures

Figure 1
Figure 1
(A) Increased steady-state levels of superoxide demonstrated by increased DHE oxidation in human colon cancer cells (HT29, HCT116, SW480) compared to normal human colon epithelial cells (FHC). Cells were plated in 60 mm dishes, grown for 48 h and then incubated with 10 µM DHE in 2 ml PBS containing 5 mM pyruvate at 37°C for 40 min in the presence or absence of 10 µM AntA. Cells were trypsinized on ice and analyzed by flow cytometry. Mean fluorescence intensity (MFI) of 10,000 cells was measured. Values are expressed as the ratio of MFI, relative to FHC cells. Error bars represent ± 1SD of 3– 9 treatment dishes done in 3 separate experiments. [* Significantly different from FHC, DHE only, p<0.05, N=3; # significantly different from FHC, DHE+AntA, p<0.05, N=3–9 ; ε significantly different from each respective DHE only group, p<0.05, N=3–9] (B) Increased steady-state levels of superoxide demonstrated by increased DHE oxidation in human colon cancer cells (HT29, HCT116, SW480) compared to normal human colon fibroblasts (33Co). Cells were grown and labeled with 10 µM DHE as described above and analyzed by flow cytometry. Mean fluorescence intensity (MFI) of 10,000 cells was measured. Values are expressed as the ratio of MFI, relative to 33Co cells. Error bars represent ± 1SD of 9 treatment dishes done in 3 separate experiments. [*Significantly different from 33Co, DHE only, p<0.05, N=9 ] (C) HCT116 cells demonstrated PEG SOD inhibitable DHE fluorescence. Cells were plated in 60 mm dishes, grown for 48 h and treated with 100 U/ml PEG SOD for 2 h prior and during DHE labeling. Cells were trypsinized on ice and analyzed by flow cytometry. Each sampling measured the MFI of 10,000 cells and corrected for autofluorescence. Error bars represent ± 1SD of 3 treatment dishes. [*Significantly different from DHE only group, p<0.05, N=3]
Figure 2
Figure 2
(A) Human cancer cells (HT29, HCT116, SW480) demonstrated significantly increases oxidation of CDCFH2 relative to normal human colon epithelial cells (FHC). Cells were plated in 60 mm dishes, grown for 48 h and then incubated with 10 µg/ml CDCFH2 in 2 ml PBS at 37°C for 15 min in the presence or absence of 10 µM AntA. Cells were trypsinized on ice and analyzed by flow cytometry. Mean fluorescence intensity (MFI) of 10,000 cells were measured. Values are expressed as the ratio of MFI relative to FHC cells. Error bars represent ± 1SD of 3– 9 treatment dishes done in 3 separate experiments. [* Significantly different from FHC, CDCFH2 only, p<0.05, N=3; significantly different from FHC, CDCFH2+AntA, p<0.05, N=3–9 ; ε significantly different from each respective CDCFH2 only group, p<0.05, N=3–9] (B) Human colon cancer cells (HT29, HCT116, SW480) demonstrated significantly increased oxidation of CDCFH2 relative to normal human colon fibroblasts (33Co). Cells were grown and labeled with 10 µg/ml CDCFH2 and analyzed by flow cytometry. Mean fluorescence intensity (MFI) of 10,000 cells was measured. Values are expressed as the ratio of MFI, relative to 33Co cells. Error bars represent ± 1SD of 9 treatment dishes done in 3 separate experiments. [*Significantly different from 33Co, CDCFH2 only, p<0.05, N=9] (C) The oxidation insensitive probe demonstrated no differences in fluorescence among normal versus cancer cells from colon tissue. Cells were plated in 60 mm dishes, grown for 48 h and then incubated with 10 µg/ml CDCF in 2 ml PBS at 37°C for 15 min. Cells were trypsinized on ice and analyzed by flow cytometry. Mean fluorescence intensity (MFI) of 10,000 cells was measured. Values are expressed as the ratio of MFI, relative to 33Co cells. Error bars represent ± 1SD of 3 treatment dishes/group done on three separate days.
Figure 3
Figure 3. Human breast cancer cells (MB231) demonstrated significantly increased oxidation of DHE and CDCFH2, relative to normal human mammary epithelial cells (HMEC)
Cells were grown and labeled with 10 µM DHE, 10 µg/ml CDCFH2, or 10 µg/ml CDCF as described in Fig 1 and Fig 2 and analyzed by flow cytometry. Mean fluorescence intensity (MFI) of 10,000 cells was measured. Values are expressed as the ratio of MFI, relative to HMEC cells. Error bars represent ± 1SD of 3 treatment dishes done in 3 separate experiments. [*Significantly different from HMEC, p<0.05, N=3].
Figure 4
Figure 4. Clonogenic survival of normal versus cancer cells from colon (A) and breast tissues (B) exposed to glucose deprivation
Cells were plated in complete media and 24 hours later they were given fresh glucose free media containing 10% dialyzed FBS, non-essential amino acids, and gentamicin. Clonogenic survival was determined at 24, 48, and 72 h and normalized to the respective control group at time zero. Errors represent ±1 SEM of 4–6 cloning dishes counted from each treatment dish done in three separate experiments [*Significantly different from 33Co for each time point, p<0.05, N=3; # Significantly different from HMEC, for each time point, p<0.05, N=3].
Figure 5
Figure 5. Over expression of MnSOD and mitoCAT in HCT116 and MB231 cells suppressed the cytotoxicity (A) as well as %GSSG (B) seen at 24 h of glucose deprivation
HCT116 and MB231 cells were transiently transduced with 50 MOI of AdMnSOD and 50 MOI of AdmitoCAT 24 h after plating. The media was changed 24 h after infection and cells were allowed to recover 24 h hours in fresh media. Cells then were treated with glucose free media for an additional 24 h and then plated for clonogenic survival. Survival data were normalized to sham treated cultures. In panel A, errors represent ±1 SEM of at least six cloning dishes counted from each treatment dish taken from two separate experiments. In panel B, errors represent ±1 SEM of three treatment dishes from each group assayed on three different days. [* Significantly different from Bgl II/+Glu, p<0.05, N=3; # significantly different from Bgl II/-Glu, p<0.05, N=3]. In panel C, MnSOD and catalase activities measured in HCT116 and MB231 cells given the indicated treatments with adenoviral vectors.
Figure 6
Figure 6. Toxicity of 20 mM 2DG in normal (FHC) cells (A) vs cancer (HT29) cells (B). Over expression of MnSOD and mitoCAT in HT29 cells suppressed cytotoxicity at 48 h of 2DG treatment (C)
In panels A and B viability was assessed using tyrpan blue dye exclusion assay of at least 100 cells from each group. Errors represent +1 SD of three measurements from each of two dishes harvested at each time point (A and B). HT29 cells were transiently transduced with 50 MOI of AdMnSOD and 50 MOI of AdmitoCAT 24 h after plating. The media was changed 24 h after infection and cells were allowed to recover 24 h hours in fresh media. Cells then were treated with 20 mM 2DG for an additional 48 h. Survival data were normalized to empty vector treated cultures (C). Errors represent ±1 SEM of at least six cloning dishes counted from each treatment dish taken from two experiments [*Significantly different from Bgl II/Control, p<0.05; # significantly different from Bgl II/2DG, p<0.05]. In panel D, MnSOD and catalase activities were measured in HT29 cells given the indicated treatments with adenoviral vectors.

References

    1. Lehninger AL. Biochemistry. New York: Worth Publishers Inc.; 1976.
    1. Warburg O. On the origin of cancer cells. Science. 1956;132:309–314. - PubMed
    1. Weber G. Enzymology of cancer cells (first of two parts) New Engl. J. Med. 1977;296:486–492. - PubMed
    1. Weber G. Enzymology of cancer cells (second of two parts) New Engl. J. Med. 1977;296:541–551. - PubMed
    1. Boveris A, Cadenas E. Production of superoxide radicals and hydrogen peroxide in mitochondria (Chapter 2) In: Oberley LW, editor. Superoxide Dimsutase. Boca Raton: CRC Press; 1982. pp. 15–30.

Publication types