Comparative Study
. 2008 Oct 20:9:494.
doi: 10.1186/1471-2164-9-494.

Empirical Bayes accomodation of batch-effects in microarray data using identical replicate reference samples: application to RNA expression profiling of blood from Duchenne muscular dystrophy patients

Affiliations
Comparative Study

Empirical Bayes accomodation of batch-effects in microarray data using identical replicate reference samples: application to RNA expression profiling of blood from Duchenne muscular dystrophy patients

Wynn L Walker et al. BMC Genomics. .

Abstract

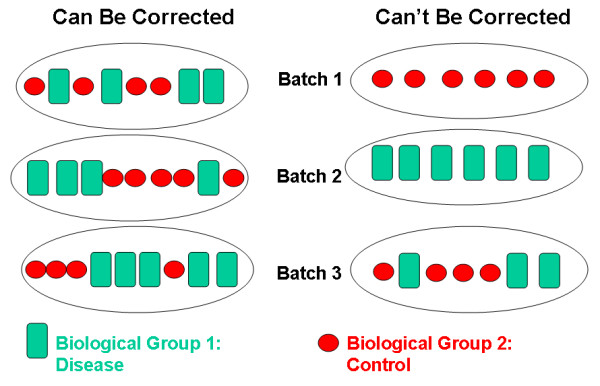
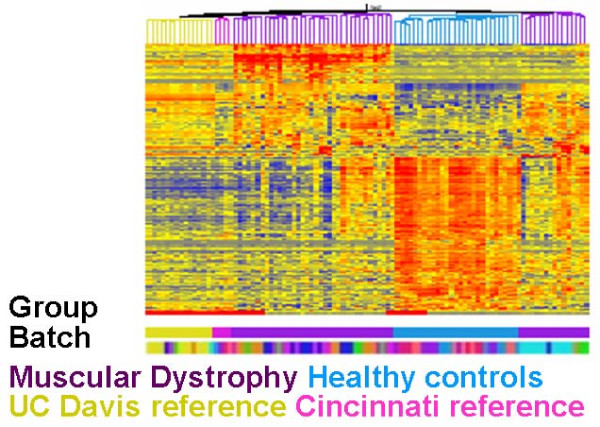
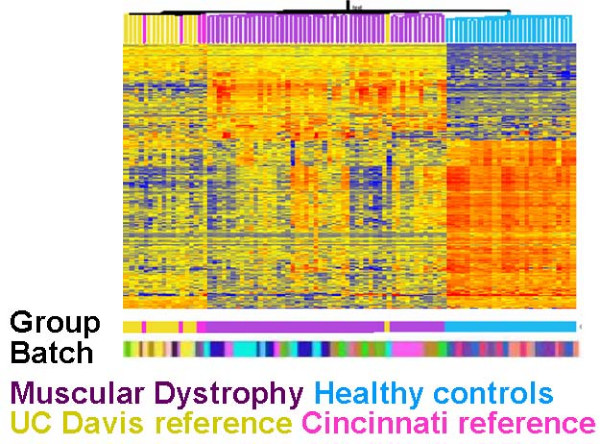
Background: Non-biological experimental error routinely occurs in microarray data collected in different batches. It is often impossible to compare groups of samples from independent experiments because batch effects confound true gene expression differences. Existing methods can correct for batch effects only when samples from all biological groups are represented in every batch.

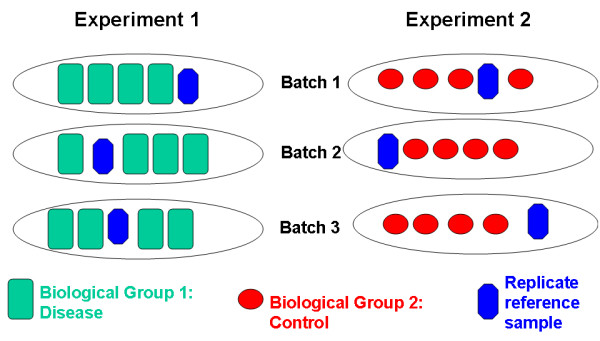
Results: In this report we describe a generalized empirical Bayes approach to correct for cross-experimental batch effects, allowing direct comparisons of gene expression between biological groups from independent experiments. The proposed experimental design uses identical reference samples in each batch in every experiment. These reference samples are from the same tissue as the experimental samples. This design with tissue matched reference samples allows a gene-by-gene correction to be performed using fewer arrays than currently available methods. We examine the effects of non-biological variation within a single experiment and between experiments.

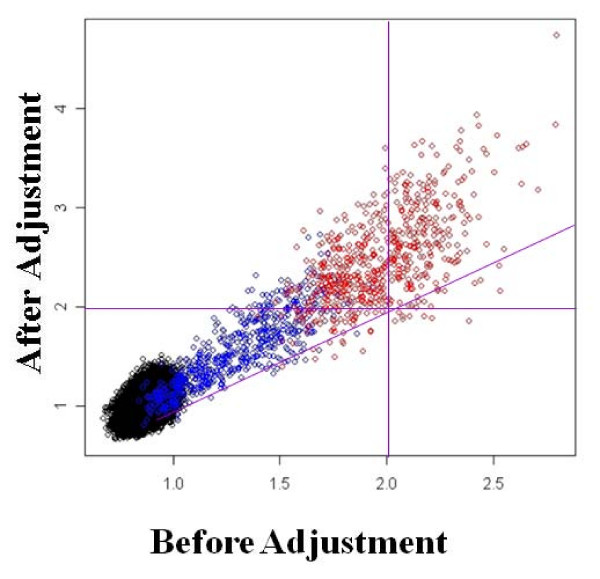
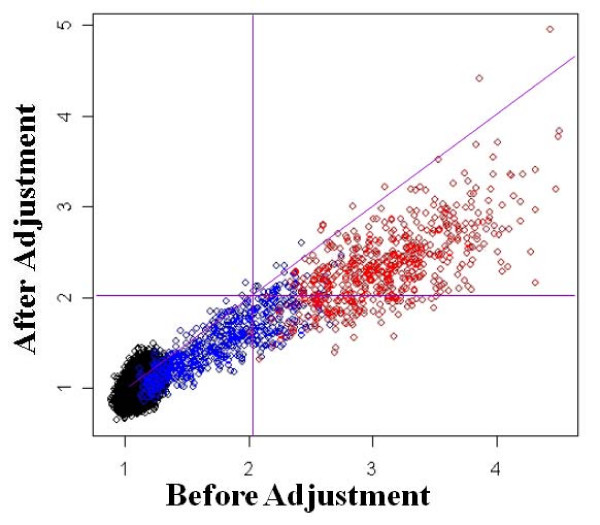
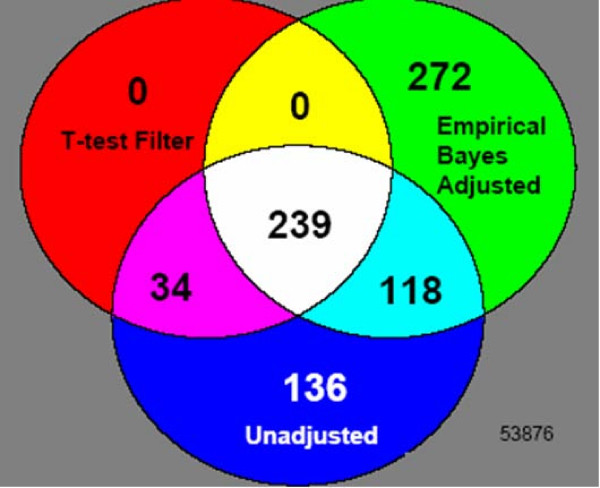
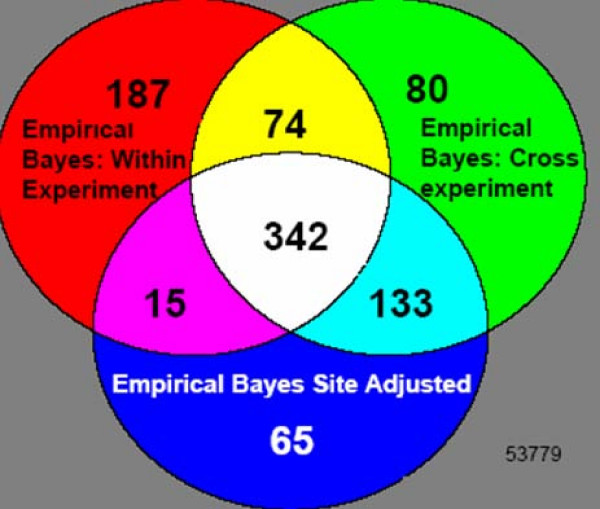
Conclusion: Batch correction has a significant impact on which genes are identified as differentially regulated. Using this method, gene expression in the blood of patients with Duchenne Muscular Dystrophy is shown to differ for hundreds of genes when compared to controls. The numbers of specific genes differ depending upon whether between experiment and/or between batch corrections are performed.


Figures

Figure 1
Figure 1
Batch processing of microarray samples from different biological groups. Examples of experimental designs that can be corrected for batch effects (left panel) and cannot be corrected for batch effects (right panel).
Figure 2
Figure 2
Experimental design with reference samples. This design enables the direct comparison of different biological groups drawn from independent experiments that would otherwise be incomparable.
Figure 3
Figure 3
Scatter plot of fold change values before and after batch adjustment for simulated data sets. Genes are color coded according to their expected difference in expression level between patients and controls. Genes with the same expected level of expression in patients and controls are shown in black, while those with an expected 1.0 to 2.0 fold higher expression level in patients are in blue, and those with a 2.1 to 3.0 fold higher expression level are in red. This simulation is performed for data in which the batch effects artificially lowered the fold change values.
Figure 4
Figure 4
Scatter plot of fold change values before and after batch adjustment for simulated data sets. Genes are color coded according to their expected difference in expression level between patients and controls. Genes with the same expected level of expression in patients and controls are shown in black, while those with an expected 1.0 to 2.0 fold higher expression level in patients are in blue, and those with a 2.1 to 3.0 fold higher expression level are in red. This simulation is performed for data in which the batch effects artificially increased the fold change values.
Figure 5
Figure 5
Heat map of gene expression values for differentially expressed genes in muscular dystrophy data set before adjustment for both within- and between-experiment batch effects. Two fold or greater increases of gene expression are shown in RED, and two fold or greater decreases of gene expression are shown in BLUE within the clusters. Note that the UC Davis reference sample group (yellow) completely separates from the Cincinnati reference sample group (pink).
Figure 6
Figure 6
Heat map of gene expression values for differentially expressed genes in muscular dystrophy data set after adjustment for both within- and between-experiment batch effects. Two fold or greater increases of gene expression are shown in RED, and two fold or greater decreases of gene expression are shown in BLUE within the clusters. Note that the UC Davis reference sample group (yellow) is interspersed with the Cincinnati reference sample group (pink).
Figure 7
Figure 7
Common Genes in lists of differentially expressed genes for three sets of gene expression values: (1) unadjusted, (2) t-test Filtered, and (3) Empirical Bayes adjusted data. There are 239 genes common to all three gene lists.
Figure 8
Figure 8
Common Genes in lists of differentially expressed genes for three different empirical Bayes adjusted data sets: (1) within experiment batch effects only, (2) cross-experiment site effects only, and (3) both cross-experiment site effects and within experiment batch effects. There are 342 genes common to all three gene lists.

References

    1. Alter O, Brown PO, Botstein D. Singular value decomposition for genome-wide expression data processing and modeling. Proc Natl Acad Sci USA. 2000;97:10101–10106. doi: 10.1073/pnas.97.18.10101. - DOI - PMC - PubMed
    1. Benito M, Parker J, Du Q, Wu J, Xiang D, Perou CM, Marron JS. Adjustment of systematic microarray data biases. Bioinformatics. 2004;20:105–114. doi: 10.1093/bioinformatics/btg385. - DOI - PubMed
    1. Johnson WE, Li C, Rabinovic A. Adjusting batch effects in microarray expression data using empirical Bayes methods. Biostatistics. 2007;8:118–127. doi: 10.1093/biostatistics/kxj037. - DOI - PubMed
    1. Nielsen TO, West RB, Linn SC, Alter O, Knowling MA, O'Connell JX, Zhu S, Fero M, Sherlock G, Pollack JR, Brown PO, Botstein D, Rijn M van de. Molecular characterisation of soft tissue tumours: a gene expression study. Lancet. 2002;359:1301–1307. doi: 10.1016/S0140-6736(02)08270-3. - DOI - PubMed
    1. Parmigiani G, Garrett ES, Irizarry RA, Zeger SL, (eds) The analysis of gene expression data: methods and software. New York Springer; 2003.

Publication types