. 2009 Jan 21;256(2):227-39.
doi: 10.1016/j.jtbi.2008.09.012. Epub 2008 Oct 2.

A new mathematical model for the homeostatic effects of sleep loss on neurobehavioral performance

Affiliations

A new mathematical model for the homeostatic effects of sleep loss on neurobehavioral performance

Peter McCauley et al. J Theor Biol. .

Abstract

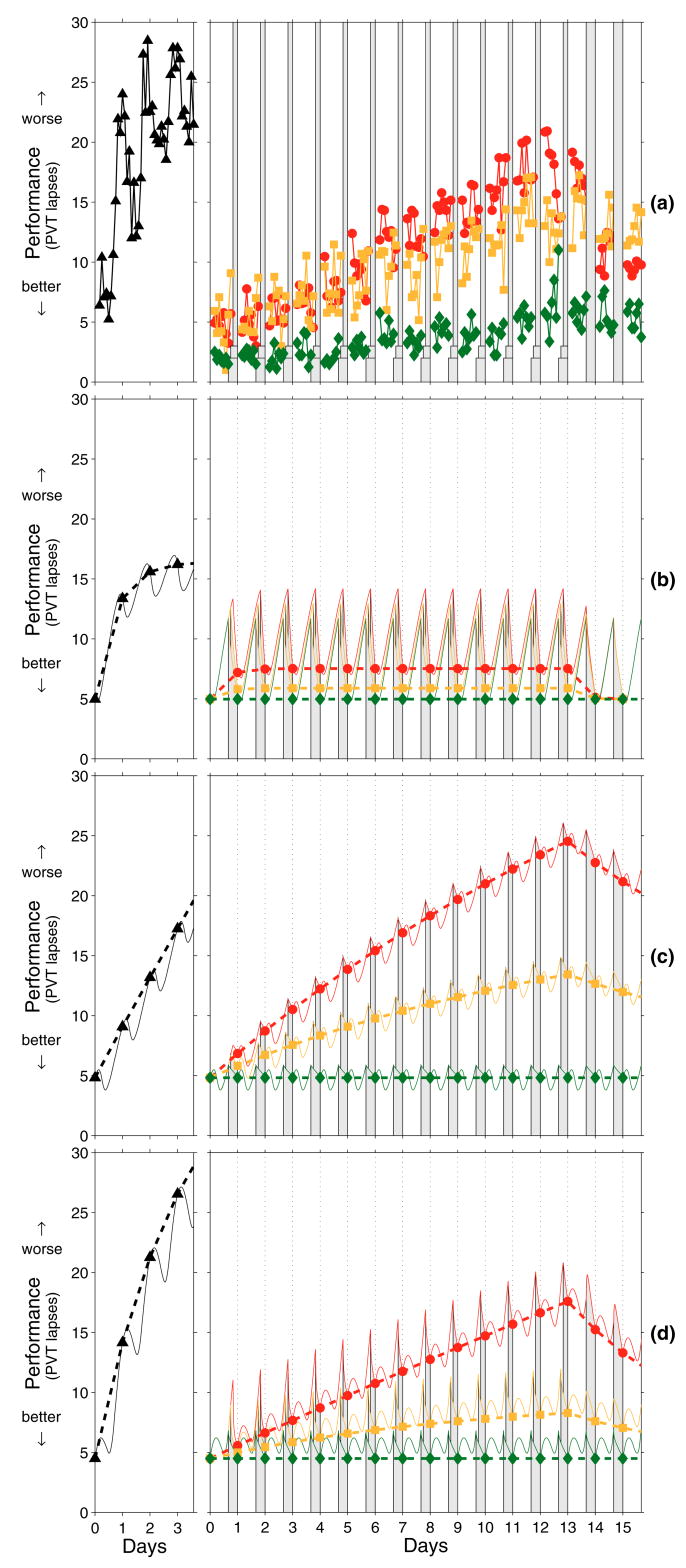
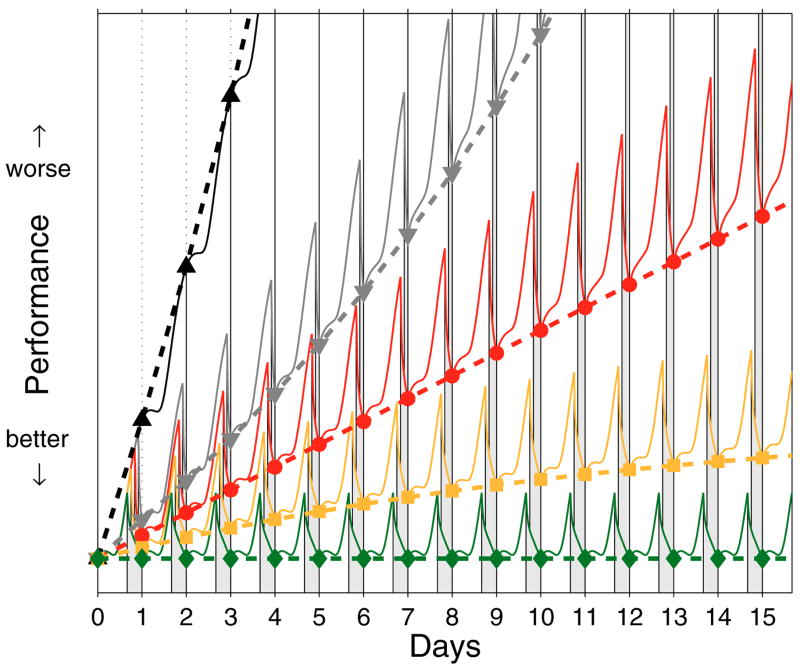
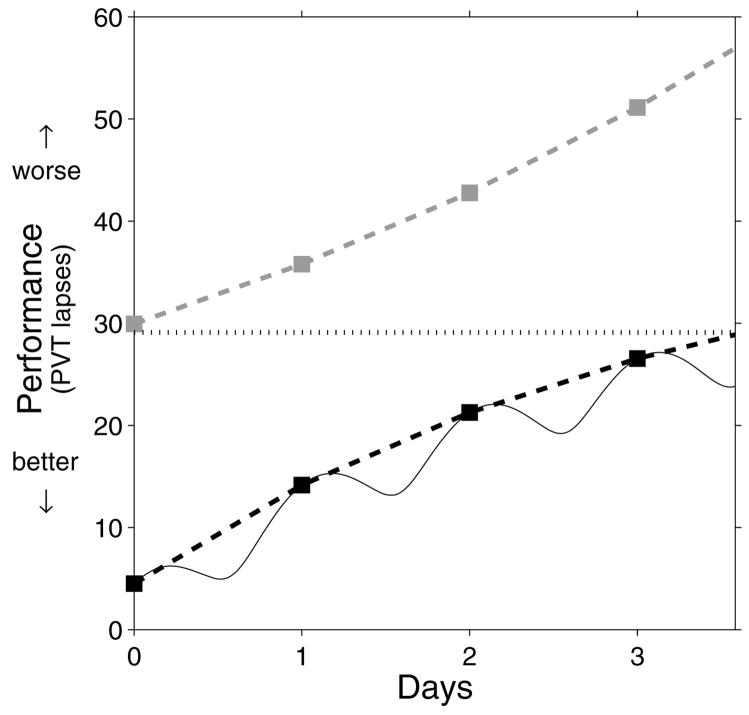
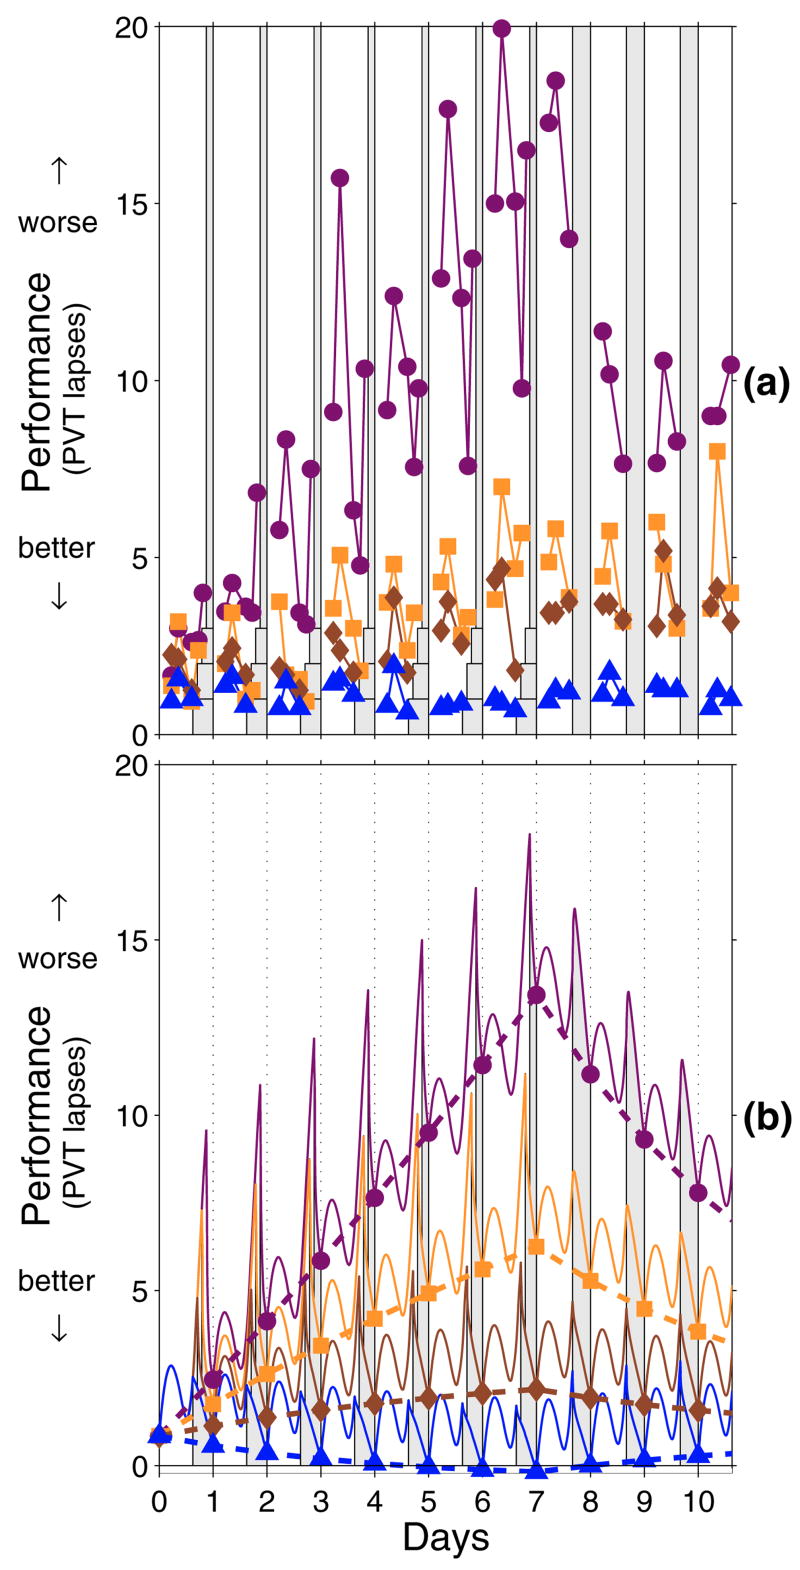
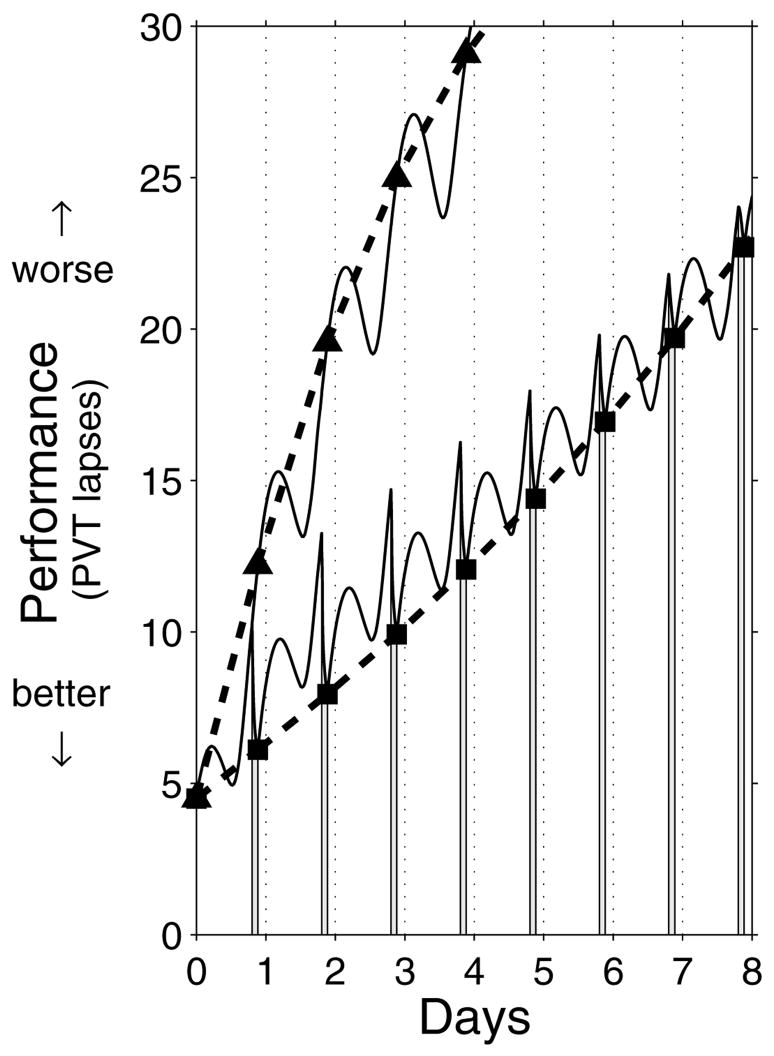
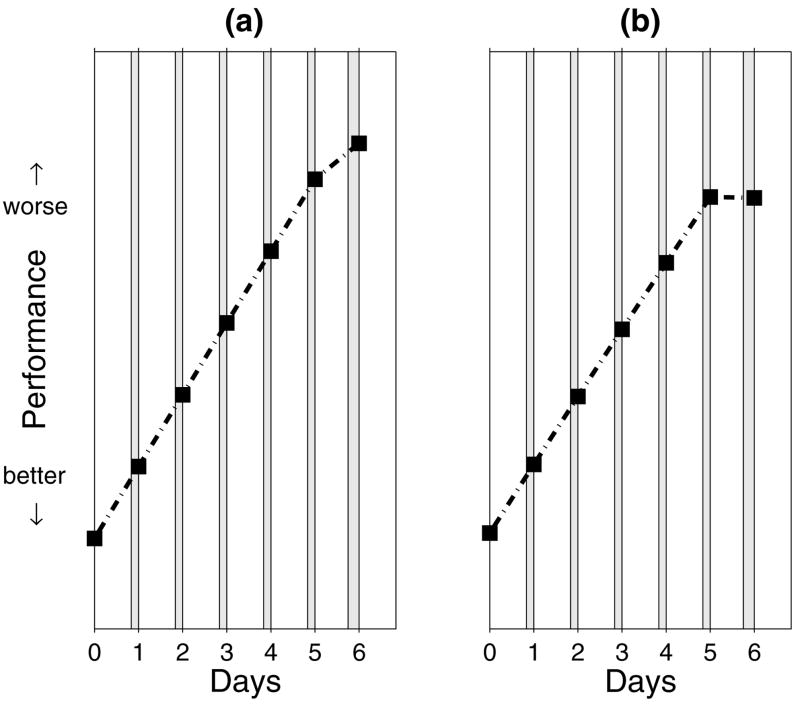
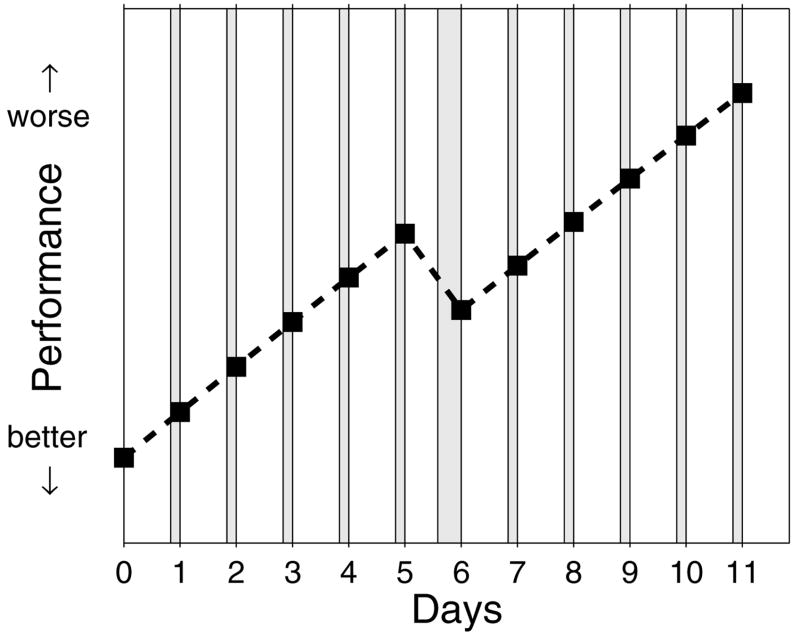
The two-process model of sleep regulation makes accurate predictions of sleep timing and duration for a variety of experimental sleep deprivation and nap sleep scenarios. Upon extending its application to waking neurobehavioral performance, however, the model fails to predict the effects of chronic sleep restriction. Here we show that the two-process model belongs to a broader class of models formulated in terms of coupled non-homogeneous first-order ordinary differential equations, which have a dynamic repertoire capturing waking neurobehavioral functions across a wide range of wake/sleep schedules. We examine a specific case of this new model class, and demonstrate the existence of a bifurcation: for daily amounts of wakefulness less than a critical threshold, neurobehavioral performance is predicted to converge to an asymptotically stable state of equilibrium; whereas for daily wakefulness extended beyond the critical threshold, neurobehavioral performance is predicted to diverge from an unstable state of equilibrium. Comparison of model simulations to laboratory observations of lapses of attention on a psychomotor vigilance test (PVT), in experiments on the effects of chronic sleep restriction and acute total sleep deprivation, suggests that this bifurcation is an essential feature of performance impairment due to sleep loss. We present three new predictions that may be experimentally verified to validate the model. These predictions, if confirmed, challenge conventional notions about the effects of sleep and sleep loss on neurobehavioral performance. The new model class implicates a biological system analogous to two connected compartments containing interacting compounds with time-varying concentrations as being a key mechanism for the regulation of psychomotor vigilance as a function of sleep loss. We suggest that the adenosinergic neuromodulator/receptor system may provide the underlying neurobiology.


Figures

Fig. 1
Fig. 1
Neurobehavioral performance observations and predictions by different models. A total of 48 healthy young adults were subjected to one of four laboratory sleep deprivation protocols (Van Dongen et al., 2003). Each protocol began with several baseline days involving 16h scheduled wake time (SWT)/8h time in bed (TIB); the last of these baseline days is labeled here as day 0. Subsequently, 13 subjects were kept awake (24h SWT/0h TIB) for three additional days, for a total of 88h awake (left panels), after which they received varied amounts of recovery sleep (not shown). The other subjects underwent various doses of sleep restriction for 14 consecutive days, followed by two recovery days with 16h SWT/8h TIB (right panels). The sleep restriction schedule involved 20h SWT/4h TIB per day for 13 subjects (circles; red); 18h SWT/6h TIB per day for another 13 subjects (boxes; yellow); and 16h SWT/8h TIB per day for the remaining 9 subjects (diamonds; green). Awakening was scheduled at 07:30 each day. Neurobehavioral performance was tested every 2h during scheduled wakefulness using the PVT, for which the number of lapses (reaction times greater than 500ms) was recorded. (a) Observed neurobehavioral performance (PVT lapses) for each test bout (dots represent group averages). The first two test bouts of each waking period are omitted in order to avoid confounds from sleep inertia. Gray bars indicate scheduled sleep periods. (b) Corresponding performance predictions according to the original two-process model (Borbély and Achermann, 1999), linearly scaled to the data. Data points represent performance predictions at wake onset. Thin curves represent predictions within days, but the focus here is on changes across days (dashed lines). Note the rapid stabilization across days predicted to occur in the chronic sleep restriction conditions (right panel), which does not match the observations shown in (a). (c) Corresponding predictions according to the extended two-process model (Avinash et al., 2005), linearly scaled to the data. Note the under-prediction of performance impairment in the total sleep deprivation condition (left panel) and the over-prediction of the impairment build-up across days in the 20h SWT/4h TIB condition (right panel), relative to the actual data shown in (a). (d) Corresponding predictions according to the new model introduced in this paper as defined by Eqs. (21) and (26). Note the improved fit to the experimental observations across days for total sleep deprivation (left panel), which is explored in more detail in Fig. 3, as well as for the 20h SWT/4h TIB condition (right panel). Performance impairment in the 18h SWT/6h TIB and 16h SWT/8h TIB conditions (right panel) is under-predicted. However, the group-average impairment levels observed for these conditions are inflated due to a few outliers (Van Dongen et al., 2003).
Fig. 2
Fig. 2
Illustration of the model given by Eqs. (21) using parameter values selected to illustrate its bifurcating dynamic behavior. The figure shows model predictions at wake onset (data points) for 16 days (n = 0, 1, …, 15) of fixed duration T = 24h, assuming a constant period τ = 24h for the non-homogeneities. The thin curves represent the predictions within days using the non-homogeneities given by Eqs. (26)—but the profile of changes across days (dashed lines) as determined by the α and σ coefficient matrices in Eqs. (21) is of primary interest here. Each prediction curve corresponds to a different amount of daily wakefulness: W = 16h (diamonds; green), W = 18h (boxes; yellow), W = 20h (circles; red), W = 22h (downward triangles; gray), and W = 24h (i.e., total sleep deprivation) (upward triangles; black). Light gray areas indicate nocturnal sleep periods. In this illustration, the model parameter values are intentionally selected such that the bifurcation threshold occurs at Wc = 20h (i.e., 4h daily sleep). For daily wake durations below this bifurcation threshold (green and yellow), the model converges to an asymptotically stable equilibrium, meaning that performance impairment ultimately levels off. For daily wake durations beyond the bifurcation threshold (gray and black), the model diverges from an unstable equilibrium, meaning that performance impairment tends to escalate. At exactly the bifurcation value W = Wc (red), there is no equilibrium state, resulting in an asymptotically linear build-up of performance impairment across days.
Fig. 3
Fig. 3
Detailed examination of the performance predictions under conditions of total sleep deprivation. The new model defined by Eqs. (21) and (26) with the parameter estimates given by Eqs. (27) has a bifurcation at Wc = 20.2h, implying that predictions for performance in the total sleep deprivation condition (i.e., W = 24h > Wc; see Fig. 1a, top left panel) should exhibit diverging (i.e., escalating) performance impairment across days. However, the actual predictions (see Fig. 1d, bottom left panel) would seem to suggest a converging pattern. This can be explained by simultaneously considering the performance predictions pn (black dashed curve), the level of the unstable equilibrium state p (dotted horizontal line), and the upper asymptote un (gray dashed curve). Since α22 > 0, the upper asymptote un increases exponentially across days. Thus, within waking episodes, performance pn is increasingly drawn upwards. On the other hand, the equilibrium level p is located above the initial performance value p0(t0). Thus, divergence from this unstable equilibrium would entail a drive downwards. Here, the net result is that performance impairment is predicted to increase across days, but in a decelerating manner (cf. Van Dongen et al., 2003). If wakefulness were maintained for additional days, though, the performance predictions would cross the unstable equilibrium state and then diverge from it upwards, exposing the typical escalating behavior for W > Wc in this model (see the illustration in Fig. 2, black upward triangles).
Fig. 4
Fig. 4
Experimental observations and predictions by our new model for neurobehavioral performance impairment. A total of 66 healthy young adults were subjected to one of four laboratory sleep deprivation protocols (Belenky et al., 2003). Each protocol began with several baseline days involving 16h scheduled wake time (SWT)/8h time in bed (TIB); the last of these baseline days is labeled here as day 0. The subjects subsequently underwent various doses of sleep restriction for seven consecutive days, followed by three recovery days with 16h SWT/8h TIB. The sleep restriction schedule involved 21h SWT/3h TIB per day for 13 subjects (circles; purple); 19h SWT/5h TIB per day for 13 subjects (boxes; orange); 17h SWT/7h TIB per day for 14 subjects (diamonds; brown); and 15h SWT/9h TIB per day for 16 subjects (triangles; blue). Awakening was scheduled at 07:00 each day. Neurobehavioral performance was tested daily at 09:00, 12:00, 15:00 and 21:00 using the PVT. In the 19h SWT/5h TIB condition an additional test bout occurred at midnight, and in the 21h SWT/3h TIB condition yet another one took place two hours after midnight. (a) Observed neurobehavioral performance (PVT lapses) for each test bout (dots represent group averages). The first test bout of each waking period is omitted in order to avoid confounds from sleep inertia. Gray bars indicate scheduled sleep periods. (b) Corresponding performance predictions according to the new model defined by Eqs. (21) and (26). Parameter estimates are fixed at the values of Eqs. (27), as previously estimated using the data in Fig. 1a. Data points represent predictions at wake onset; thin curves represent predictions within days. The focus here is on changes across days (dashed lines). Note that the model predictions across the seven days of sleep restriction accurately capture the qualitative change from convergence (i.e., leveling off of performance impairment) in the 15h, 17h and 19h SWT conditions, to divergence (i.e., disproportionately rapid escalation of performance impairment) in the 21h SWT/3h TIB condition.
Fig. 5
Fig. 5
Prediction of the effectiveness of a single 2h nocturnal period of nap sleep each day for maintaining performance across days. The figure shows predicted performance at wake onset (boxes) and within each of the days (thin curve) across 8 days with a nap scheduled from 02:45 until 04:45 daily (gray bars). For comparison, predicted performance across 4 days of total sleep deprivation is shown as well (triangles represent performance at 04:45, which is the same time as scheduled wake onset in the nap condition). Both conditions are initiated after awakening from 8h baseline sleep at 07:30 (dashed vertical lines indicate 07:30 at 24h increments). The performance predictions, derived from the new model given by Eqs. (21), (26) and (27) and expressed in terms of the number of lapses on the PVT, indicate that a daily 2h nap is not effective at maintaining reasonable levels of performance across multiple days. (For a discussion of the predictions for the total sleep deprivation condition, see Fig. 3, but note that the timing of wake onset is not the same.)
Fig. 6
Fig. 6
Opposing predictions from two models regarding recovery following chronic sleep restriction. The figure shows performance predictions at wake onset (boxes) for five days with 20h wakefulness and 4h sleep per day, followed by one day with 18h wakefulness and 6h recovery sleep. Gray areas indicate nocturnal sleep periods. (a) Predictions for performance changes across days according to the excess wakefulness model (Van Dongen et al., 2003). This model predicts that performance deteriorates progressively across the five days with 20h wake/4h sleep, and continues to deteriorate at a slower rate following the day with 18h wake/6h sleep. (b) Predictions for performance changes across days according to the model defined by Eqs. (21), (26) and (27). This new model also predicts that performance deteriorates progressively across the five days with 20h wake/4h sleep, but forecasts a modest relative performance improvement following the day with 18h wake/6h sleep. (Note that sleep inertia is not accounted for in these predictions.)
Fig. 7
Fig. 7
New prediction for rapid recycling after a period of chronic sleep restriction. The figure shows predicted performance at wake onset (boxes) over days, during a period of five days with wake extension to 20h per day (i.e., 4h sleep daily), followed by one day with 14h scheduled wakefulness (i.e., 10h for recovery sleep), followed by recycling into a second period of five days with wake extension to 20h per day (4h sleep daily). Gray areas indicate nocturnal sleep periods. The performance predictions, derived from the new model given by Eqs. (21), (26) and (27), indicate that the intermittent recovery sleep should confer only a short-lasting benefit—in the second period of sleep restriction, performance is predicted to further deteriorate (while converging towards the asymptotically stable equilibrium for W = 20h with a time constant extending far beyond the period displayed in the graph).

References

    1. Achermann P. The two-process model of sleep regulation revisited. Aviat Space Environ Med. 2004;75:A37–A43. - PubMed
    1. Achermann P, Borbély AA. Simulation of daytime vigilance by the additive interaction of a homeostatic and a circadian process. Biol Cybern. 1994;71:115–121. - PubMed
    1. Åkerstedt T, Folkard S. The three-process model of alertness and its extension to performance, sleep latency, and sleep length. Chronobiol Int. 1997;14:115–123. - PubMed
    1. Avinash D, Crudele CP, Amin DD, Robinson BM, Dinges DF, Van Dongen HPA. Parameter estimation for a biomathematical model of psychomotor vigilance performance under laboratory conditions of chronic sleep restriction. In: Ruigt GSF, Van Bemmel AL, DeBoer T, Hofman WF, Van Luijtelaar G, editors. Sleep-Wake Research in the Netherlands. Vol. 16. Dutch Society for Sleep-Wake Research; The Netherlands: 2005. pp. 39–42.
    1. Banks S, Dinges DF. Behavioral and physiological consequences of sleep restriction. J Clin Sleep Med. 2007;3:519–528. - PMC - PubMed

Publication types