

Prosecutor: parameter-free inference of gene function for prokaryotes using DNA microarray data, genomic context and multiple gene annotation sources
- PMID: 18939968
- PMCID: PMC2585105
- DOI: 10.1186/1471-2164-9-495
Prosecutor: parameter-free inference of gene function for prokaryotes using DNA microarray data, genomic context and multiple gene annotation sources
Abstract
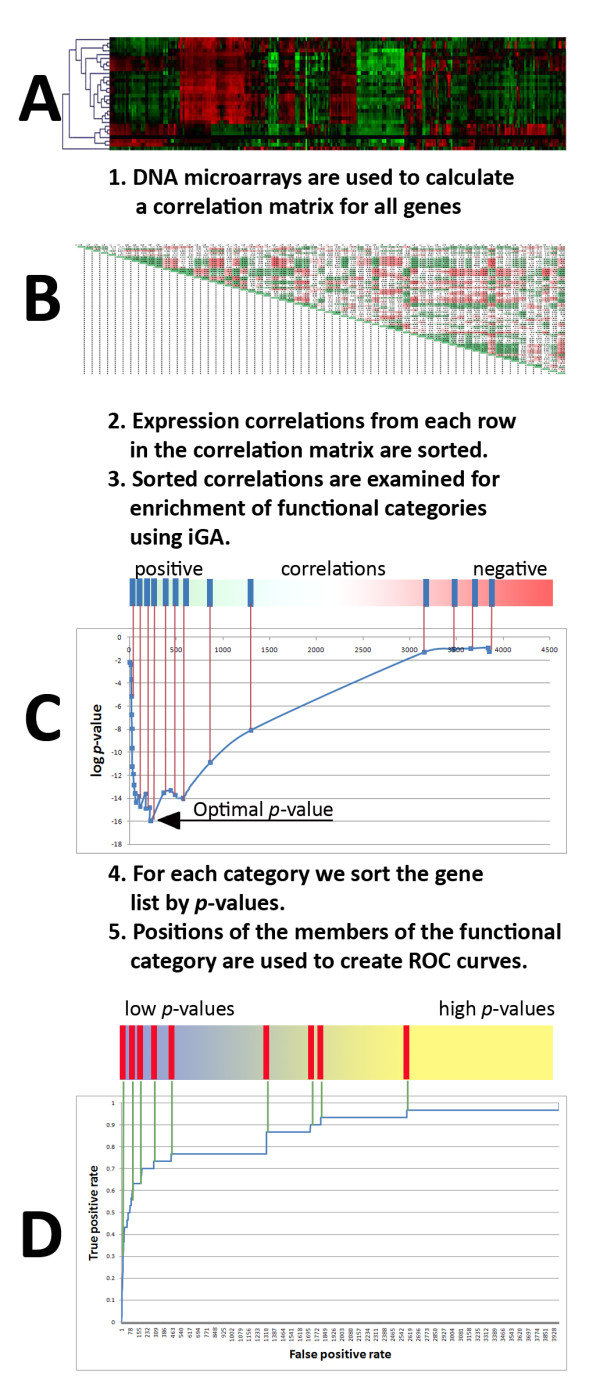
Background: Despite a plethora of functional genomic efforts, the function of many genes in sequenced genomes remains unknown. The increasing amount of microarray data for many species allows employing the guilt-by-association principle to predict function on a large scale: genes exhibiting similar expression patterns are more likely to participate in shared biological processes.
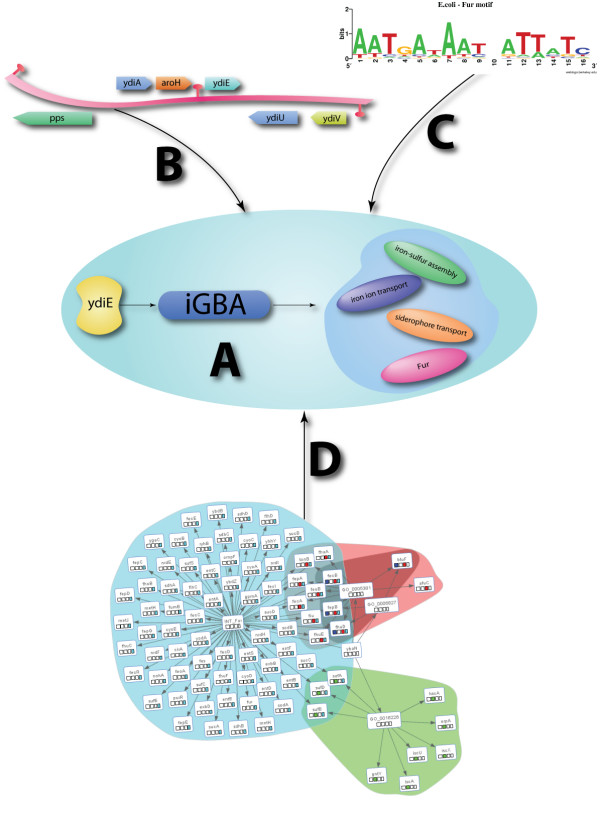
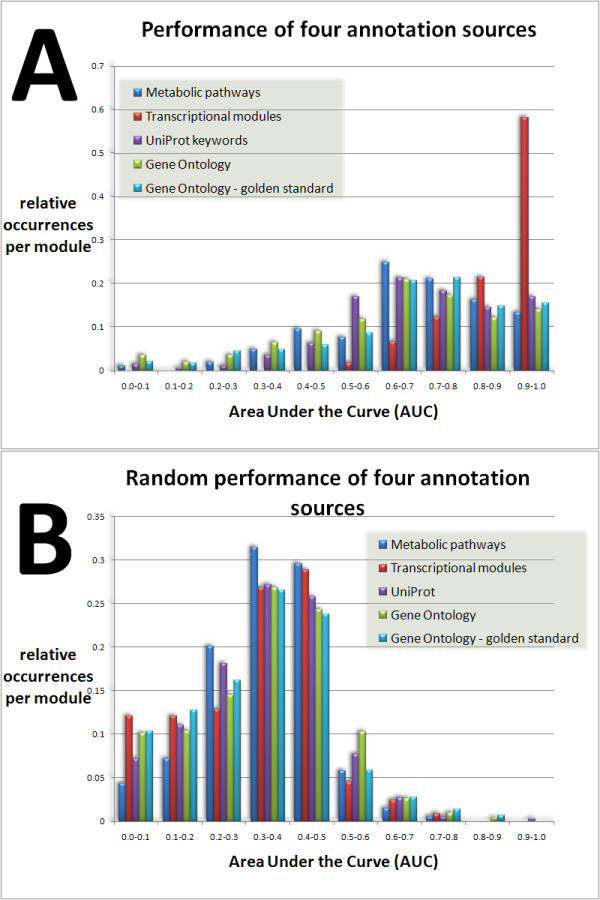
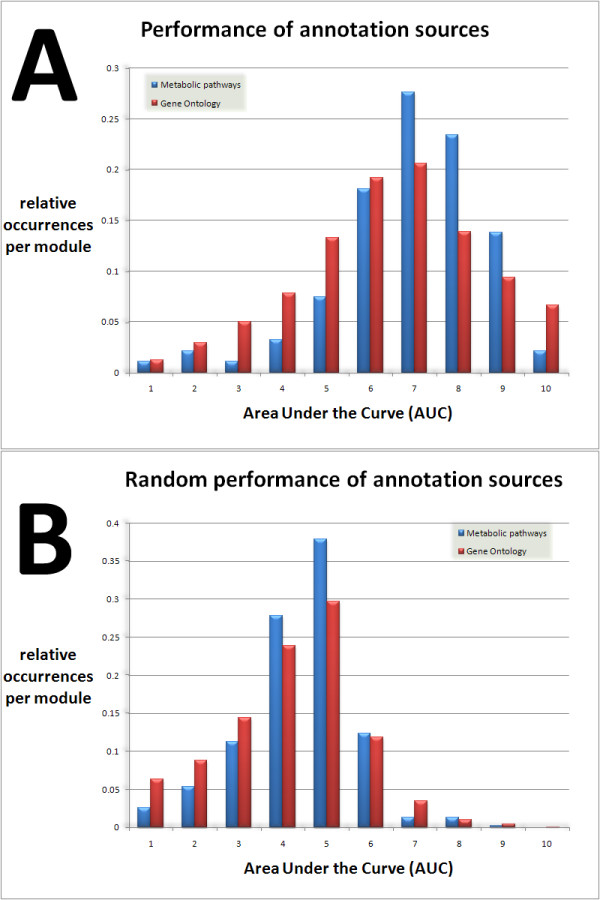
Results: We developed Prosecutor, an application that enables researchers to rapidly infer gene function based on available gene expression data and functional annotations. Our parameter-free functional prediction method uses a sensitive algorithm to achieve a high association rate of linking genes with unknown function to annotated genes. Furthermore, Prosecutor utilizes additional biological information such as genomic context and known regulatory mechanisms that are specific for prokaryotes. We analyzed publicly available transcriptome data sets and used literature sources to validate putative functions suggested by Prosecutor. We supply the complete results of our analysis for 11 prokaryotic organisms on a dedicated website.
Conclusion: The Prosecutor software and supplementary datasets available at http://www.prosecutor.nl allow researchers working on any of the analyzed organisms to quickly identify the putative functions of their genes of interest. A de novo analysis allows new organisms to be studied.
Figures
Similar articles
-
AVID: an integrative framework for discovering functional relationships among proteins.BMC Bioinformatics. 2005 Jun 1;6:136. doi: 10.1186/1471-2105-6-136. BMC Bioinformatics. 2005. PMID: 15929793 Free PMC article.
-
Combining multisource information through functional-annotation-based weighting: gene function prediction in yeast.IEEE Trans Biomed Eng. 2009 Feb;56(2):229-36. doi: 10.1109/TBME.2008.2005955. Epub 2008 Sep 30. IEEE Trans Biomed Eng. 2009. PMID: 19272921
-
MiCoViTo: a tool for gene-centric comparison and visualization of yeast transcriptome states.BMC Bioinformatics. 2004 Mar 3;5:20. doi: 10.1186/1471-2105-5-20. BMC Bioinformatics. 2004. PMID: 15053844 Free PMC article.
-
Genomic studies of transcription factor-DNA interactions.Curr Opin Chem Biol. 2005 Feb;9(1):38-45. doi: 10.1016/j.cbpa.2004.12.008. Curr Opin Chem Biol. 2005. PMID: 15701451 Review.
-
A guide to the integrated application of on-line data mining tools for the inference of gene functions at the systems level.Biotechnol J. 2008 Nov;3(11):1375-87. doi: 10.1002/biot.200800142. Biotechnol J. 2008. PMID: 18830970 Review.
Cited by
-
An ontology for microbial phenotypes.BMC Microbiol. 2014 Nov 30;14:294. doi: 10.1186/s12866-014-0294-3. BMC Microbiol. 2014. PMID: 25433798 Free PMC article.
-
Discriminative local subspaces in gene expression data for effective gene function prediction.Bioinformatics. 2012 Sep 1;28(17):2256-64. doi: 10.1093/bioinformatics/bts455. Epub 2012 Jul 20. Bioinformatics. 2012. PMID: 22820203 Free PMC article.
-
Advances in human papillomavirus detection for cervical cancer screening and diagnosis: challenges of conventional methods and opportunities for emergent tools.Anal Methods. 2025 Feb 13;17(7):1428-1450. doi: 10.1039/d4ay01921k. Anal Methods. 2025. PMID: 39775553 Free PMC article. Review.
-
A Fast and Reliable Pipeline for Bacterial Transcriptome Analysis Case study: Serine-dependent Gene Regulation in Streptococcus pneumoniae.J Vis Exp. 2015 Apr 25;(98):52649. doi: 10.3791/52649. J Vis Exp. 2015. PMID: 25938895 Free PMC article.
References
-
- Overbeek R, Begley T, Butler RM, Choudhuri JV, Chuang HY, Cohoon M, de Crécy-Lagard V, Diaz N, Disz T, Edwards R, Fonstein M, Frank ED, Gerdes S, Glass EM, Goesmann A, Hanson A, Iwata-Reuyl D, Jensen R, Jamshidi N, Krause L, Kubal M, Larsen N, Linke B, McHardy AC, Meyer F, Neuweger H, Olsen G, Olson R, Osterman A, Portnoy V, Pusch GD, Rodionov DA, Rückert C, Steiner J, Stevens R, Thiele I, Vassieva O, Ye Y, Zagnitko O, Vonstein V. The subsystems approach to genome annotation and its use in the project to annotate 1000 genomes. Nucleic Acids Res. 2005;33:5691–5702. doi: 10.1093/nar/gki866. - DOI - PMC - PubMed
Publication types
MeSH terms
LinkOut - more resources
Full Text Sources
