. 2008 Oct 21:7:79.
doi: 10.1186/1476-4598-7-79.

Rhabdomyosarcoma cells show an energy producing anabolic metabolic phenotype compared with primary myocytes

Affiliations

Rhabdomyosarcoma cells show an energy producing anabolic metabolic phenotype compared with primary myocytes

Teresa W M Fan et al. Mol Cancer. .

Abstract

Background: The functional status of a cell is expressed in its metabolic activity. We have applied stable isotope tracing methods to determine the differences in metabolic pathways in proliferating Rhabdomysarcoma cells (Rh30) and human primary myocytes in culture. Uniformly 13C-labeled glucose was used as a source molecule to follow the incorporation of 13C into more than 40 marker metabolites using NMR and GC-MS. These include metabolites that report on the activity of glycolysis, Krebs' cycle, pentose phosphate pathway and pyrimidine biosynthesis.

Results: The Rh30 cells proliferated faster than the myocytes. Major differences in flux through glycolysis were evident from incorporation of label into secreted lactate, which accounts for a substantial fraction of the glucose carbon utilized by the cells. Krebs' cycle activity as determined by 13C isotopomer distributions in glutamate, aspartate, malate and pyrimidine rings was considerably higher in the cancer cells than in the primary myocytes. Large differences were also evident in de novo biosynthesis of riboses in the free nucleotide pools, as well as entry of glucose carbon into the pyrimidine rings in the free nucleotide pool. Specific labeling patterns in these metabolites show the increased importance of anaplerotic reactions in the cancer cells to maintain the high demand for anabolic and energy metabolism compared with the slower growing primary myocytes. Serum-stimulated Rh30 cells showed higher degrees of labeling than serum starved cells, but they retained their characteristic anabolic metabolism profile. The myocytes showed evidence of de novo synthesis of glycogen, which was absent in the Rh30 cells.

Conclusion: The specific 13C isotopomer patterns showed that the major difference between the transformed and the primary cells is the shift from energy and maintenance metabolism in the myocytes toward increased energy and anabolic metabolism for proliferation in the Rh30 cells. The data further show that the mitochondria remain functional in Krebs' cycle activity and respiratory electron transfer that enables continued accelerated glycolysis. This may be a common adaptive strategy in cancer cells.


Figures

Figure 1
Figure 1
Metabolic scheme. Carbon flow from [U-13C]-glucose through glycolysis, Krebs cycle, PPP, pyruvate carboxylation, malate/Asp shuttle, and synthesis of GSH and pyrimidine nucleotides as discussed in the text. Also shown are the expected 13C isotopomers of key metabolites in this network. Excretion of lactate and Ala into serum is part of the alanine and Cori cycles. Solid oval represents the plasma membrane and the dashed oval represents the mitochondrial space. Double-headed arrows: exchange or reversible processes. The label patterns arise from [U-13C]-glucose. Open circles: 12C; filled circles: 13C. Glc = glucose, G6P = glucose-6-phosphate, Rib = nucleotide ribose, DHAP, GAP = dihydroxyacetone phosphate and glyceraldehyde-3-phosphate, PEP = phosphoenolpyruvate, Pyr = pyruvate, Lac = lactate, Cit = citrate, 2 = OG = 2-oxoglutarate, Mal = malate, OAA = oxalacetate, U = uracil base. Critical enzymes are shown in cyan. HK= hexokinase (entry to glycolysis), G6PDH = glucose-6-phosphate dehydrogenase (entry to the oxidative branch of the pentose phosphate pathway), TK, TA transketolase and transaldolase (non-oxidative pentose phosphate pathway), PK = pyruvate kinase, PDH = pyruvate dehydrogenase, PC = pyruvate carboxylase, AAT = aspartate amino transferase, MDH = malate dehydrogenase, ME = malic enzyme. Glutaminolysis is the pathway from Gln to pyruvate via ME, leading to unlabeled malate, Asp, Ala and lactate. Where two patterns are shown in the Krebs' cycle intermediates, this is due to the scrambling at the succinate step (first turn only). For U and OAA, the labeling from PC activity gives rise to a third labeling pattern, shown in red. The isotopomer pattern for U shows the three ring carbons (4,5,6) derived from Asp. The exchange of [13C-1,2,3]-Asp via the malate/Asp shuttle into the cytosol leads to the synthesis of [13C-1,2,3]-malate.
Figure 2
Figure 2
Concentration of metabolites in cell extracts of Rh30 cells and myocytes. Concentrations were determined by GC-MS as described in the text. A, B: Total concentrations of selected metabolites normalized to cell dry weight.
Figure 3
Figure 3
Concentration of metabolites in cell extracts of Rh30 cells and myocytes. Concentrations were determined by GC-MS as described in the text. A, B: mass isotopomer concentrations of selected metabolites showing increased labeled incorporation in Rh30 cells.
Figure 4
Figure 4
Concentration of metabolites in media from Rh30 cells and myocytes. Concentrations were determined by GC-MS as described in the text. Mass isotopomer concentrations of lactate and Ala secreted by Rh30 cells or myocytes into the medium.
Figure 5
Figure 5
1H NMR spectra of Rh30 and myocyte cell extracts. NMR spectra were recorded at 600 MHz, 20°C with a recycle time of 5 sec. Cells were grown in the presence 0.2% [U-13C]-glucose for 24 h (Rh30) or 48 h (myocytes). Upper myocytes, lower Rh30. Spectra were scaled to dry weight to show the difference in absolute concentrations of metabolites
Figure 6
Figure 6
Alanine and Lactate isotopomer patterns in Rh30 cell extract. 1H NMR spectrum expansion of the Rh30 cell extract spectrum from Figure 5 showing the satellite peaks of lactate and Ala.
Figure 7
Figure 7
2-D 1H-13C HSQC analysis of Rh30 cells and myocytes. Both cells were cultured in [U-13C]-glucose for 24 hr before trichloroacetic acid extraction and HSQC measurement at 14.4 T. The spectra were recorded with 0.14 s acquisition in t2 and 34 ms in t1. The data table in t1 was linear predicted to 1024 complex points and zero filled to 2048, so that 13C-13C couplings (35–45 Hz) were resolved. Panel C displays the 2-D contour map of the Rh30 cell extract while panels B and A are respectively the 1-D 13C projection spectra of the 2-D contour maps for Rh30 and myocytes. Both A and B were normalized to cell dry weight but A was plotted at 10× scale relative to B.
Figure 8
Figure 8
TOCSY Spectra of Rh30 cell extract. TOCSY spectrum of TCA extract of Rh30 cells grown for 24 h in the presence of 0.2% [U-13C]-glucose and 10% FCS, using a mixing time of 50 ms and a spin lock strength of 8 kHz. Aliphatic region of the spectrum showing connectivities and satellite peaks for some assigned metabolites.
Figure 9
Figure 9
TOCSY Spectra of Rh30 cell extract. Expansion of the spectrum shown in Figure 8. A. Glu/Ala/Lac region expansion from A. The boxes show the 13C satellite peaks for Ala, Lac and Glu and the absence of labeling in Pro and Thr. Ala and lactate show only fully unlabeled and fully labeled cross peak patterns, whereas the Glu cross peak patterns exhibit both singly and doubly labeled isotopomer species (cf. [35]. B. The partial TOCSY spectral region displays the cross-peak patterns of singly and doubly labeled species for the 5- and 6-ring protons of 5'UXP.
Figure 10
Figure 10
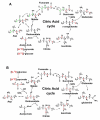
13C labeling patterns in products of glycolysis, PPP and mitochondrial Krebs cycle with [U-13C]-Glc as tracer. The Krebs' cycle reactions are depicted without (panel A) or with (panel B) anaplerotic pyruvate carboxylation (PC) and the labeling patterns illustrated represent one turn of cycle activity. Two distinct 13C labeling patterns in Glu result from the cycle reactions with (panel B) or without PC (panel A), i.e. 13C labeling at C2,3 or C4,5, respectively. Isotopic scrambling occurs at the symmetric succinate, leading to the redistribution of 13C labels into C1 and C2 or C3 and C4 (panel A). Also depicted in panel B is the malate/Asp shuttle across the mitochondrial membrane, where the export of [13C-1,2,3]-Asp into the cytosol leads to the synthesis of [13C-1,2,3]-malate. Red C and green C represent 13C labeled carbons; solid and dashed arrows denote single and multi-step reactions, respectively; open arrows in panel A delineate unlabeled starting oxaloacetate (OAA) from 13C-labeled OAA after one turn; open arrow in panel B denotes the start of a second cycle; double headed arrows indicate reversible or exchange reactions; SCS denotes succinyl CoA synthetase.
Figure 11
Figure 11
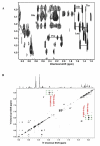
HCCH TOCSY spectrum of myocyte cell extract. 48 h myoctye cells and 24 h Rh30 cells grown in the presence of [U-13C]-glucose were extracted as described in the methods. 1D NMR spectra were recorded at 18.8 T as described in the methods and elsewhere[35]. The HCCH TOCSY spectrum of the myocyte extract was recorded with a mixing time of 12 ms showing cross peak patterns of consecutively labeled carbons of glycogen resonances, G6P and fully labeled ribose moieties of nucleotides (e.g. 5'AXP), lactate, Ala, and Glu.
Figure 12
Figure 12
HSQC TOCSY spectrum of myocyte cell extract. Sugar region of a high resolution HSQC-TOCSY spectrum of myocytes recorded with a mixing time of 50 ms. The resolution in F1 is adequate to show 13C-13C splittings in for example the beta form of G6P. upper: 1D projection, lower: 2D spectrum

References

    1. Jankowski K, Kucia M, Wysoczynski M, Reca R, Zhao D, Trzyna E, Trent J, Peiper S, Zembala M, Ratajczak J, et al. Both hepatocyte growth factor (HGF) and stromal-derived factor-1 regulate the metastatic behavior of human rhabdomyosarcoma cells, but only HGF enhances their resistance to radiochemotherapy. Cancer Research. 2003;63:7926–7935. - PubMed
    1. Libura J, Drukala J, Majka M, Tomescu O, Navenot JM, Kucia M, Marquez L, Peiper SC, Barr FG, Janowska-Wieczorek A, Ratajczak MZ. CXCR4-SDF-1 signaling is active in rhabdomyosarcoma cells and regulates locomotion, chemotaxis, and adhesion. Blood. 2002;100:2597–2606. - PubMed
    1. Wysoczynski M, Miekus K, Jankowski K, Wanzeck J, Bertolone S, Janowska-Wieczorek A, Ratajczak J, Ratajczak MZ. Leukemia inhibitory factor: A newly identified metastatic factor in rhabdomyosarcomas. Cancer Research. 2007;67:2131–2140. - PubMed
    1. Scotlandi K, Picci P. Targeting insulin-like growth factor 1 receptor in sarcomas. Current Opinion in Oncology. 2008;20:419–427. - PubMed
    1. Baer C, Nees M, Breit S, Selle B, Kulozik AE, Schaefer KL, Braun Y, Wai D, Poremba C. Profiling and functional annotation of MRNA gene expression in pediatric rhabdomyosarcoma and Ewing's sarcoma. Int J Cancer. 2004;110:687–694. - PubMed

Publication types

LinkOut - more resources