Comparative Study
. 2008 Oct 9;60(1):162-73.
doi: 10.1016/j.neuron.2008.08.007.

Context-dependent changes in functional circuitry in visual area MT

Affiliations
Comparative Study

Context-dependent changes in functional circuitry in visual area MT

Marlene R Cohen et al. Neuron. .

Abstract

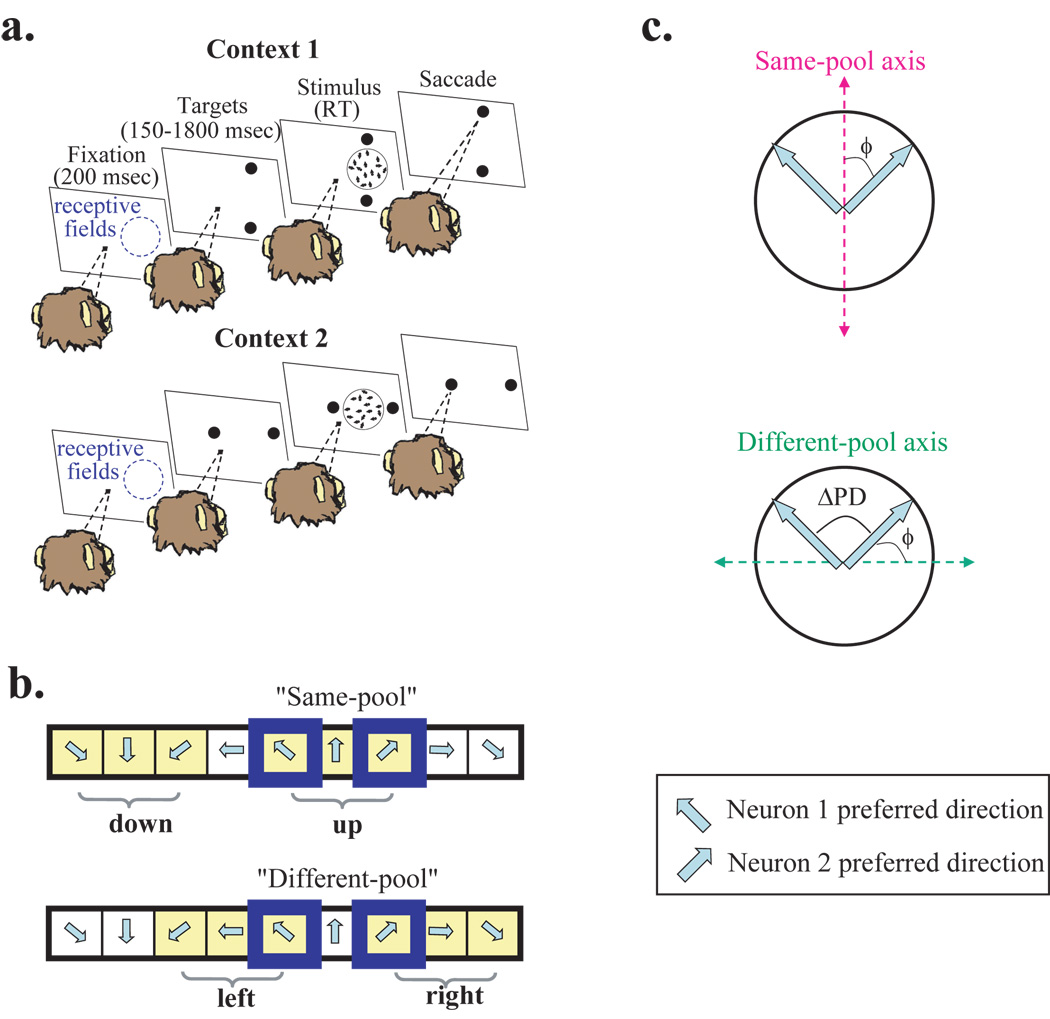
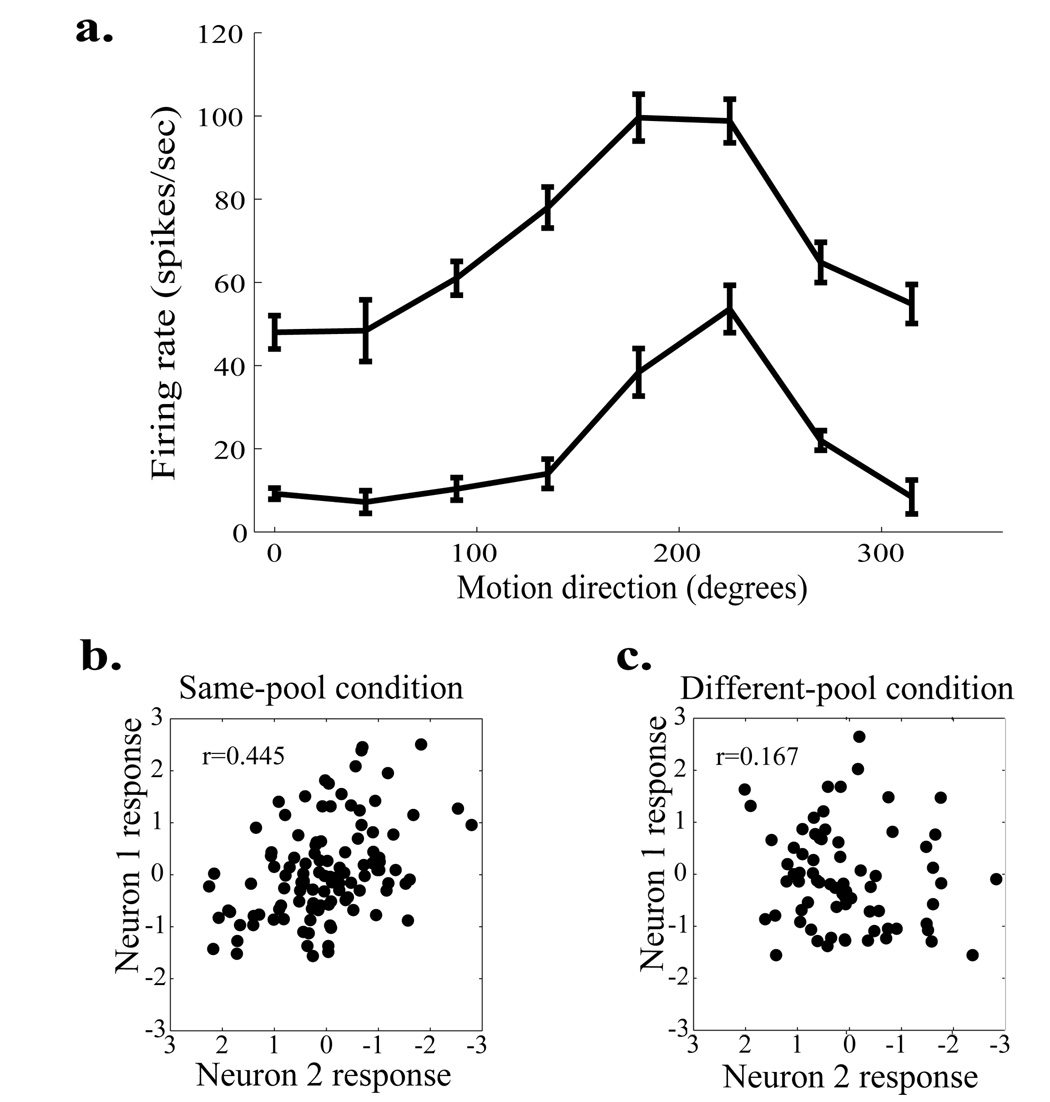
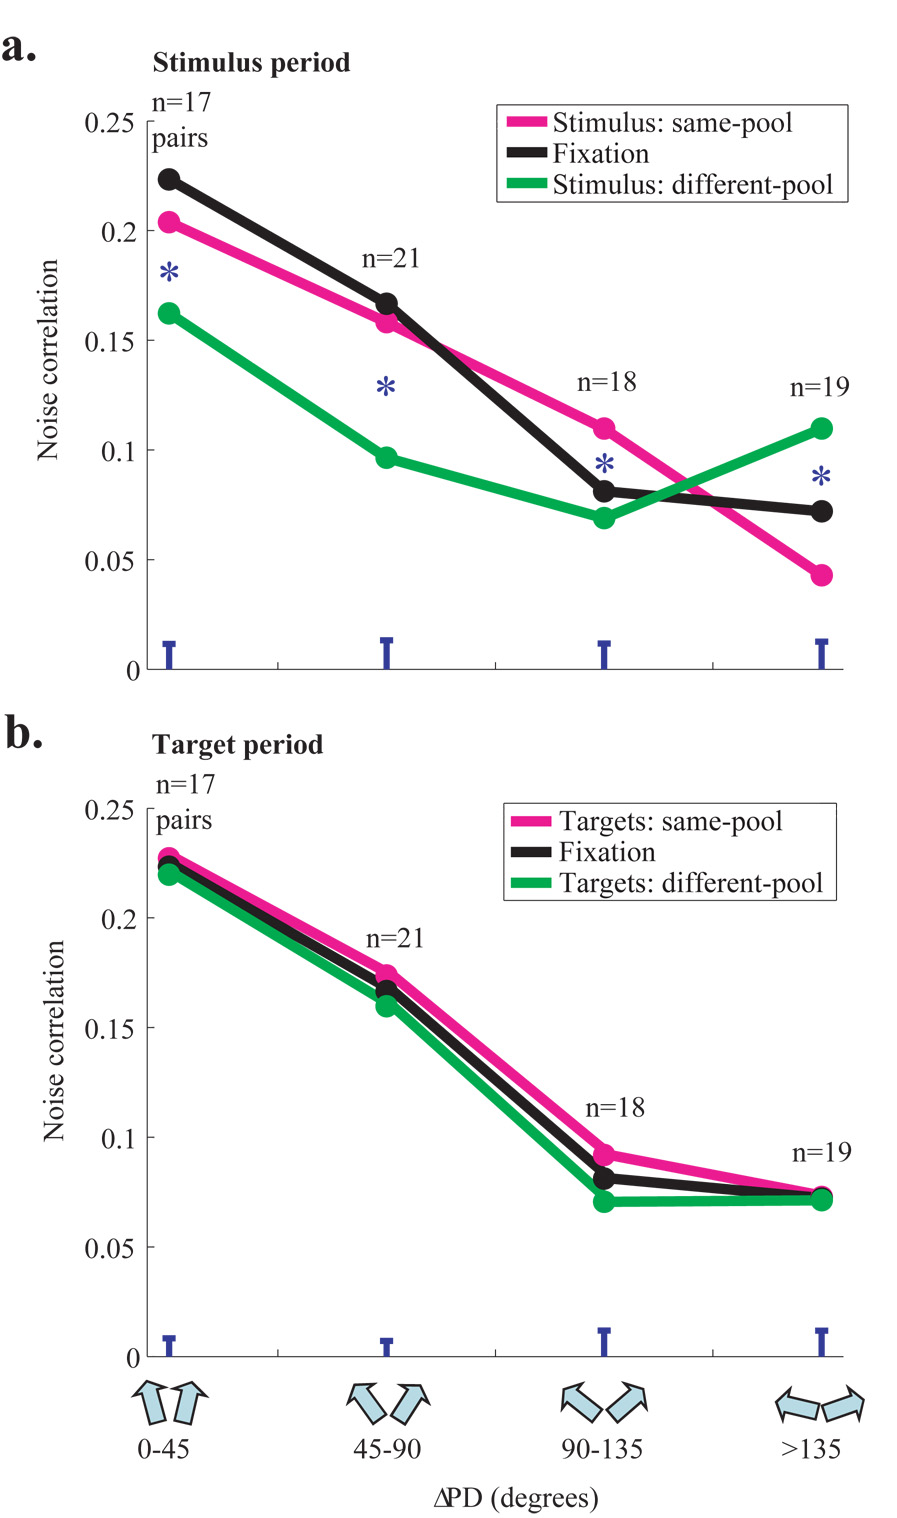
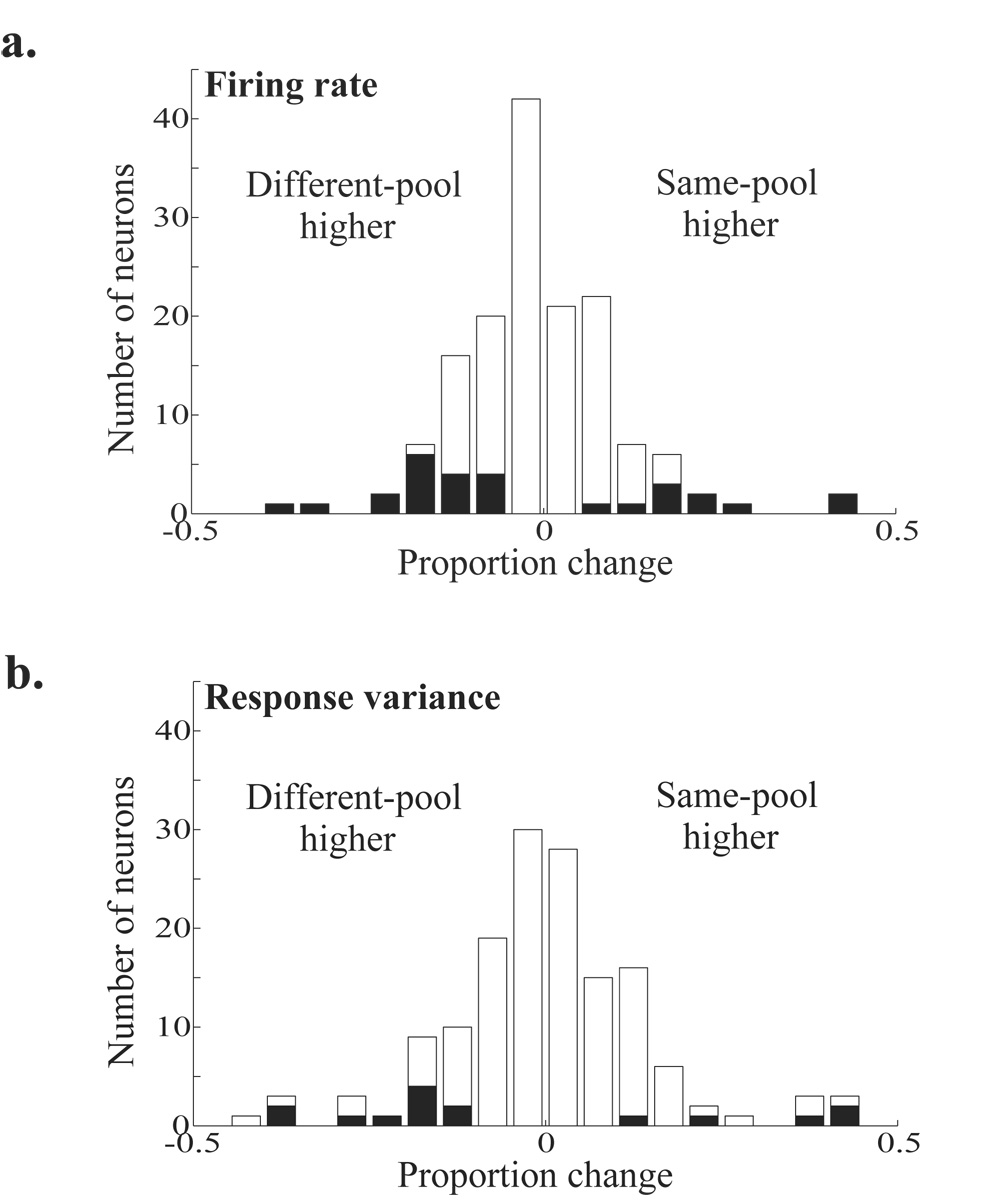
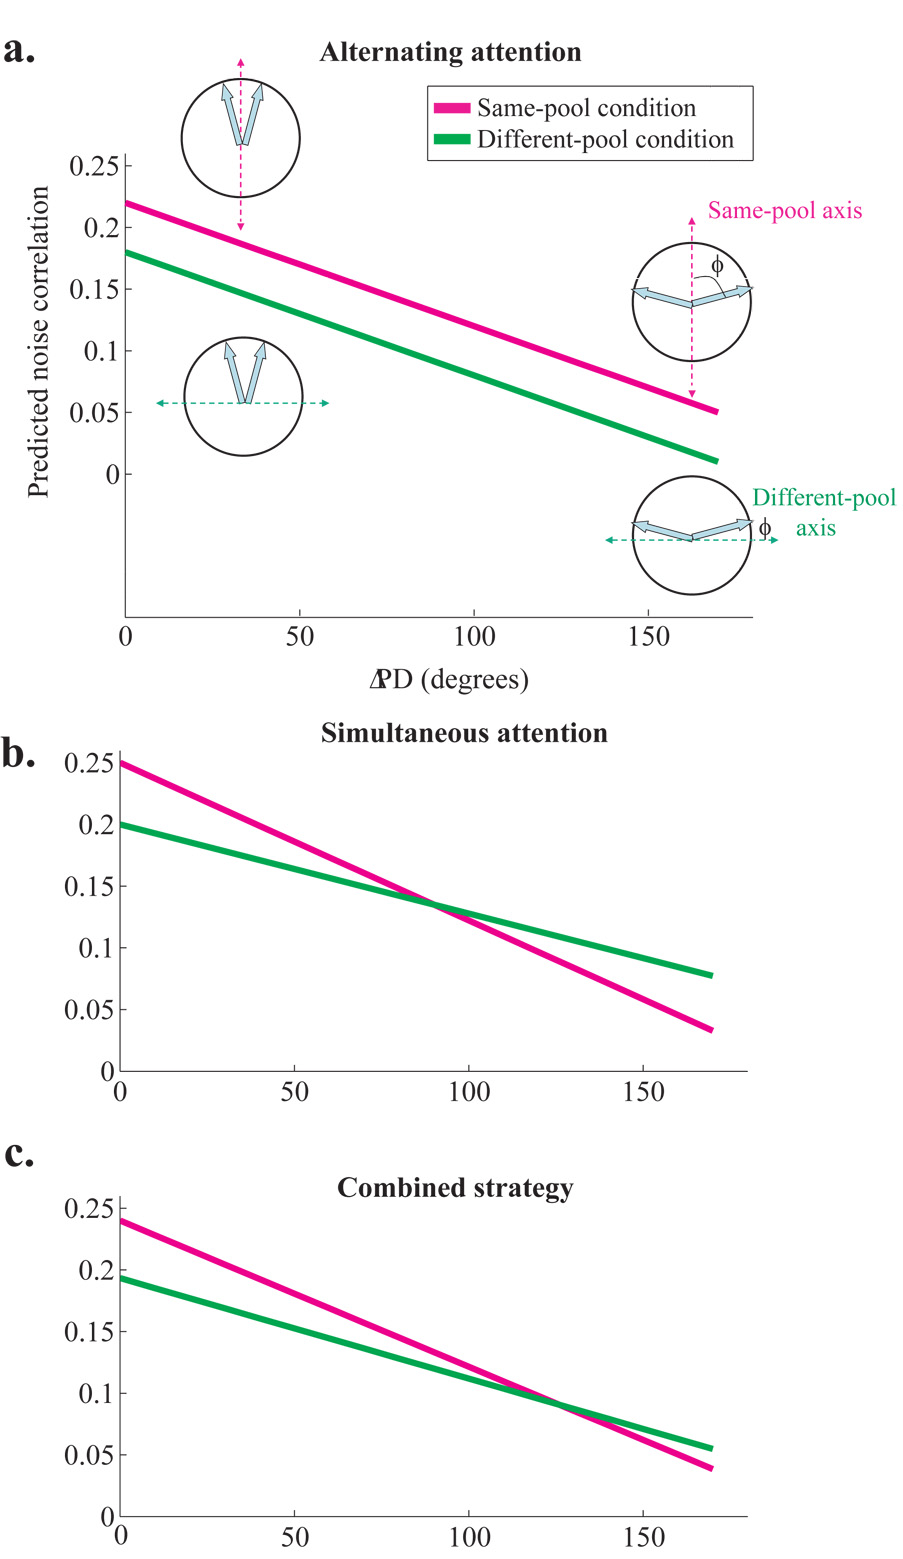
Animals can flexibly change their behavior in response to a particular sensory stimulus; the mapping between sensory and motor representations in the brain must therefore be flexible as well. Changes in the correlated firing of pairs of neurons may provide a metric of changes in functional circuitry during behavior. We studied dynamic changes in functional circuitry by analyzing the noise correlations of simultaneously recorded MT neurons in two behavioral contexts: one that promotes cooperative interactions between the two neurons and another that promotes competitive interactions. We found that identical visual stimuli give rise to differences in noise correlation in the two contexts, suggesting that MT neurons receive inputs of central origin whose strength changes with the task structure. The data are consistent with a mixed feature-based attentional strategy model in which the animal sometimes alternates attention between opposite directions of motion and sometimes attends to the two directions simultaneously.


Figures

Figure 1
Figure 1. Behavioral task and experimental strategy
a. Schematic of the behavioral task. We record from pairs of well-isolated single MT neurons whose receptive fields are largely overlapping (first panel, blue dotted line). A trial begins when the monkey fixates a central spot of light (first panel, fixation period). After 200 msec, two saccade targets appear, the position of which indicates the direction of motion to be discriminated on the upcoming trial (second panel, target period). Two orthogonal axes of motion are randomly interleaved from trial to trial (top and bottom). After a random period of time, the stimulus appears in the union of the neurons’ receptive fields (third panel, stimulus period). The monkey is free to indicate his direction judgment with a saccade to the appropriate target at any point after the stimulus appears. The stimulus and fixation point disappear as soon as his eyes leave the fixation window (fourth panel). Schematic of MT direction columns. Top panel: same-pool condition. Blue squares indicate the preferred directions of two hypothetical neurons under study. When the monkey performs an up-down discrimination task, the two neurons both contribute to the pool of neurons indicating upward motion (yellow shaded region). Bottom panel: different-pool condition. When the monkey performs a left-right discrimination task, the same two neurons contribute to opposite pools; one neuron contributes to the pool indicating leftward motion (first shaded region) while the other neuron contributes to the pool of rightward preferring neurons. c. Selection of motion axes. We defined the axis of motion for the same-pool condition (magenta dashed line, top panel) as the axis that bisected the angle between the preferred directions of the two neurons under study (light blue arrows). The different-pool condition axis (green dashed line, bottom panel) was orthogonal to the same-pool axis. We refer to the angle between the preferred directions of the neurons under study as ΔPD and the difference between a neuron’s preferred direction and the axis of motion being discriminated as ϕ.
Figure 2
Figure 2. Correlation results for an example pair of neurons
a. Tuning curves for each neuron. Mean firing rate (spikes/second) is shown for eight directions of motion (500 msec stimulus presentations). Error bars represent the standard error of the mean (5–8 presentations of each motion direction). The difference between preferred directions (ΔPD) for this pair was 20°. b. Scatter plot of firing rate Z-scores for 0% coherence trials (see Experimental Procedures) for neuron 1 (y-axis) vs. neuron 2 (x-axis) in the same-pool condition (113 trials). The trial-to-trial fluctuations in firing rate were correlated, and the correlation coefficient was 0.445. c. Same axes and neurons as b, in the different-pools condition (121 trials). The correlation coefficient here was 0.167.
Figure 3
Figure 3
a. Frequency histogram of context-dependent differences in correlation for pairs of neurons with ΔPD<135° The x-axis plots correlation in the same-pool condition minus correlation in the different-pools condition. The black arrow indicates the population mean, and shaded bars indicate individual experiments for which this metric was significantly different from 0 (p<0.05, bootstrap test described in Experimental Procedures). b. Same conventions, for pairs with ΔPD>135°.
Figure 4
Figure 4. Noise correlation as a function of ΔPD
a. Mean noise correlation during the stimulus period in each of four ΔPD bins for the same-pool (magenta) and different-pool (green) conditions. The black line represents noise correlation during the initial fixation period (while the monkey fixated a blank screen). The asterisks indicate that mean noise correlation was significantly different in the same and different-pool conditions for each bin. Because noise correlation even during the fixation period varied substantially from pair to pair even within a ΔPD bin (for example, mean fixation correlation for the ΔPD<45° bin was 0.223, and standard deviation was 0.180), all of our statistics were based on the pairwise difference in correlation between the same- and different-pool contexts for each pair. The blue error bars at the bottom of Figures 4a and b indicate standard errors on these differences for each bin. b. Conventions are the same as in a, but the magenta and green lines are correlation during the target period. The black line is the same as in a. There were no bins for which the difference in correlation between the same and different-pool conditions was statistically significant.
Figure 5
Figure 5. Absence of context-dependent changes in firing rate and variance
a. Frequency histogram of context-dependent changes in firing rate. The x-axis represents the proportion change in firing rate [(same pool-different pool)/different pool] on 0% coherence trials for each MT neuron. Shaded bars indicate cells that had individually significant context-dependent changes in firing rate (p<0.05, t-test). b. Conventions as in a, but for variance rather than mean firing rate.
Figure 6
Figure 6. Noise correlation predictions from a feature-attention-like mechanism
Conventions are the same as Figure 4. a. Prediction noise correlation if the monkey employed the “alternating attention” strategy. The four schematics in the corners of the graph show the relationship between the preferred directions of the two hypothetical neurons under study (blue arrows) and the axis of motion in the same-pool condition (magenta dashed line) and the different pool condition (green dashed line). b. Conventions as in a, for the “simultaneous attention” strategy. c. Conventions as in a, for a combined strategy (see text).

Similar articles

Cited by

References

    1. Aertsen AM, Gerstein GL, Habib MK, Palm G. Dynamics of neuronal firing correlation: modulation of "effective connectivity". Journal of Neurophysiology. 1989;61:900–917. - PubMed
    1. Ahissar E, Vaadia E, Ahissar M, Bergman H, Arieli A, Abeles M. Dependence of cortical plasticity on correlated activity of single neurons and on behavioral context. Science. 1992a;257(5075):1412–1415. - PubMed
    1. Ahissar M, Ahissar E, Bergman H, Vaadia E. Encoding of sound-source location and movement: activity of single neurons and interactions between adjacent neurons in the monkey auditory cortex. J Neurophysiology. 1992b;67(1):203–215. - PubMed
    1. Asaad WF, Rainer G, Miller EK. Neural activity in the primate prefrontal cortex during associative learning. Neuron. 1998;21(6):1399–1407. - PubMed
    1. Asaad WF, Rainer G, Miller EK. Task-specific neural activity in the primate prefrontal cortex. J Neurophysiology. 2000;84(1):451–459. - PubMed

Publication types