. 2008 Oct 9;3(4):391-401.
doi: 10.1016/j.stem.2008.07.027.

Dynamic equilibrium and heterogeneity of mouse pluripotent stem cells with distinct functional and epigenetic states

Affiliations

Dynamic equilibrium and heterogeneity of mouse pluripotent stem cells with distinct functional and epigenetic states

Katsuhiko Hayashi et al. Cell Stem Cell. .

Abstract

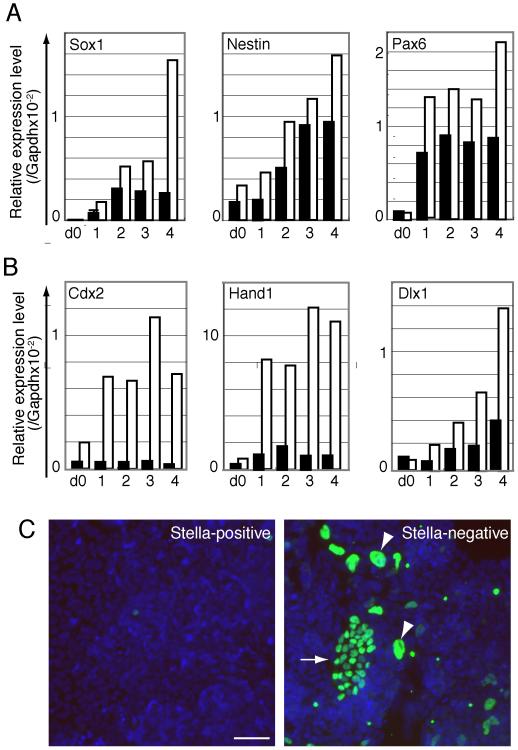
Embryonic stem cells (ESCs) are apparently homogeneous self-renewing cells, but we observed heterogeneous expression of Stella in ESCs, which is a marker of pluripotency and germ cells. Here we show that, whereas Stella-positive ESCs were like the inner cell mass (ICM), Stella-negative cells were like the epiblast cells. These states were interchangeable, which reflects the metastability and plasticity of ESCs. The established equilibrium was skewed reversibly in the absence of signals from feeder cells, which caused a marked shift toward an epiblast-like state, while trichostatin A, an inhibitor of histone deactelylase, restored Stella-positive population. The two populations also showed different histone modifications and striking functional differences, as judged by their potential for differentiation. The Stella-negative ESCs were more like the postimplantation epiblast-derived stem cells (EpiSCs), albeit the stella locus was repressed by DNA methylation in the latter, which signifies a robust epigenetic boundary between ESCs and EpiSCs.


Figures

Figure 1
Figure 1. Heterogeneous expression of Stella in undifferentiated ESCs.
(A-C) Immunoflurescence analysis of Stella-GFP (A) and endogenous Stella (B) expression in transgenic stella-gfp SH10.10 ESCs, and their merged images with DAPI (C). Scale bar: 25 μm. (D) Percentage of Stella-GFP-positive cells in control ces3 ESCs (ESWT; left), stella-gfp SH10.10 (middle) and stella-gfp BAC9 (right) transgenic lines. Numbers above the gates indicate the percentage of the total cells plotted in each dotplot. Numbers described in upper left indicate the passage number.
Figure 2
Figure 2. Differential gene expression in Stella-positive and Stella-negative population of stella-gfp SH10.10 ESCs.
(A) Q-PCR analysis of each gene in FACS-sorted Stella-GFP-positive and Stella-GFP-negative populations. Relative levels of each gene expression are estimated by referring to the value of Gapdh. The mean values are calculated from three independent experiments. (B) Q-PCR analysis using randomly selected single cells from stella-gfp ESCs. Left graph shows the putative number (log10) of transcript in each single cell. Three populations, Stellahigh, Stellalow and Stellanegative were identified and are set apart by broken lines. Right graph shows the average number of transcripts in each population.
Figure 3
Figure 3. ESCs display a state of dynamic equilibrium
(A) Stella-GFP-positive/Pecam1-positive (green) and Stella-GFP-negative/Pecam1-negative (yellow) FACS-sorted stella-gfp ESCs were cultured for 7 days. The percentage of cells with Stella-GFP expression was analyzed on day 0, 3, 5 and 7. Gating was determined independently at each time point using unsorted stella-gfp ESCs analysed in parallel as a reference. The percentage of gated cells is given in the upper corner of each dotplot. (B) Summary of phenotypic changes in Stella-GFP-positive/Pecam1-positive and Stella-GFP-negative/Pecam1-negative cells. Note that the Stella-GFP-positive/Pecam1-positive cells (green cells) revert to the original proportion more quickly than the Stella-GFP-negative/Pecam1-negative (yellow) cells. Cells depicted with white cytoplasm indicate Stella-GFP-negative/Pcam1-positive cells. (C) Clonal analysis of Stella-GFP-positive/Pecam1-positive and Stella-GFP-negative/Pecam1-negative FACS-sorted stella-gfp ESCs. Cells were expanded for 9 days and the percentage of Stella-GFP-positive cells in each independent clone (n=64) determined by FACS analysis. The averaged percentage is shown in each graph. (D) Different rate of colony formation of Stella-GFP-positive/Pecam1-positive and Stella-GFP-negative/Pecam1-negative stella-gfp ESCs. The averaged numbers of colonies from Stella-GFP-positive/Pecam1-positive and Stella-GFP-negative/Pecam1-negative FACS-sorted stella-gfp ESCs are shown. The mean values are calculated from three independent experiments.
Figure 4
Figure 4. Epigenetic regulaton of the stella locus and modulation of Stella-GFP-positive cells.
(A) ChIP analysis of histone modifications in the Stella locus. Genomic DNAs from FACS-sorted Stella-GFP-positive/Pecam1-positive or Stella-GFP-negative/Pecam1-negative cells were immunoprecipitated with the antibodies as indicated, and were then subjected to Q-PCR using a primer set specific to the endogenous genomic locus encoding the start codon of Stella. Levels of histone modifications were estimated by dividing with the input value (see mateials and methods). (B) Bisulfite sequencing profiles of DNA methylation of the stella locus. CpG sequences are shown with filled (methylated) and open (unmethylated) circles. Gaps in the methylation profiles represent mutated or missing CpG sites. The numbers under the bisulfite sequencing profiles show the percentages of methylated CpG. (C) FACS analysis of Stella-GFP-positive cells under various conditions. Shown are the percentages of Stella-GFP-positive cells after culturing stella-gfp ESCs without MEFs (upper left), followed by re-culturing them on MEFs in chemically defined medium (upper right), or exposing them to TSA (lower left) or 5-aza (lower right) in the absence of MEFs. (D) Morphology of the colonies of stella-gfp ESCs cultured with TSA. Images show the change in morphology of the stella-gfp ESC colonies cultured without MEF (left), and than following addition of TSA (right). Note the relatively more compact ESC colonies in the latter. Windows in each image represent Stella-GFP in a colony. Scale bar: 50μm
Figure 5
Figure 5. Differentiation potential of Stella-positive and Stella-negative populations.
(A) Response to retinoic acid-induced differentiation and expression of neuronal markers. Graphs show a representative Q-PCR analysis of Sox1, Nestin and Pax6 expression in FACS-sorted Stella-GFP-positive/Pecam1-positive (black) and Stella-GFP-negative/Pecam1-negative (white) ESCs cultured with RA as for days (d) as indicated. Samples at d0 were prepared immediately after FACS-sorting followed by RA-induction. (B) Expression of trophoectoderm marker genes. Graph shows representative Q-PCR analysis of Cdx2, Hand and Dlx1 expression in each subpopulation, as described in (A) when cultured under TS cell condition. Repeated Q-PCR analysis using different sets of sorted samples showed similar results as shown in both (A) and (B). (C) Enhanced expression of Cdx2 protein. Images are immunostaining of Cdx2 (green) and DAPI (blue) in each subpopulation cultured for 3 days under TS condition. Arrow and arrowhead indicate representative Cdx2-positive dense colony and cells having large nuclei, respectively. Scale bar: 50μm
Figure 6
Figure 6. Distinctive status of ESCs and EpiSCs.
(A) Q-PCR analysis of gene expression in FACS-sorted EpiSCs populations of Stella-GFP-positive and Stella-GFP-negative/Pecam1-negative ESC. Relative levels of gene expression in EpiSCs were estimated by reference to the value of Gapdh. (B) ChIP analysis of histone modifications in the stella locus of EpiSCs. Genomic DNAs were immunoprecipitated from FACS-sorted EpiSCs with antibodies as indicated, followed by Q-PCR analysis. Levels of histone modifications were estimated as indicated in Figure 2A. (C) FACS analysis of Pecam1 and SSEA1 in EpiSCs. Histograms show expression of Pecam1 (left) and SSEA1 (right). (D) Bisulfite sequencing profiles of DNA methylation in the Stella locus in EpiSCs. CpG sequences are shown with filled (methylated) and open (unmethylated) circles. Gaps in the methylation profiles represent mutated or missing CpG sites. The numbers under the bisulfite sequencing profiles show the percentages of methylated CpG. (E) Bisulfite sequencing profiles of LINE-1. Sequences are shown with filled (methylated) and open (unmethylated) circles. The numbers under the bisulfite sequencing profiles show the percentages of methylated CpG.
Figure 7
Figure 7. Proposed model for the maintenance of dynamic equilibrium of distinct cell types in ESCs.
ESCs represented as consisting of distinct subpopulations of cells, each of which has a different combination of developmentally regulated genes spanning between the ICM to epiblast-like phenotype. The mechanism that drives ESCs from ICM to epiblast-like cells may be similar to that involved in the differentiation of ICM to epiblast in vivo, but the mechanism involved in the reversion of epiblast-like cells back to ICM-like cells suggests a dedifferentiation step; the mechanism regulating the latter is unknown. The self-renewal ‘region’ of ESCs is distinct from that in EpiSCs. Notably, DNA methylation of the stella locus is one criteria that distinguishing ESCs from EpiSCs (see text for details).

References

    1. Ansel KM, Lee DU, Rao A. An epigenetic view of helper T cell differentiation. Nat Immunol. 2003;4:616–623. - PubMed
    1. Avilion AA, Nicolis SK, Pevny LH, Perez L, Vivian N, Lovell-Badge R. Multipotent cell lineages in early mouse development depend on SOX2 function. Genes Dev. 2003;17:126–140. - PMC - PubMed
    1. Brons IG, Smithers LE, Trotter MW, Rugg-Gunn P, Sun B, Chuva de Sousa Lopes SM, Howlett SK, Clarkson A, Ahrlund-Richter L, Pedersen RA, Vallier L. Derivation of pluripotent epiblast stem cells from mammalian embryos. Nature. 2007;448:191–195. - PubMed
    1. Chambers I, Colby D, Robertson M, Nichols J, Lee S, Tweedie S, Smith A. Functional expression cloning of Nanog, a pluripotency sustaining factor in embryonic stem cells. Cell. 2003;113:643–655. - PubMed
    1. Chambers I, Silva J, Colby D, Nichols J, Nijmeijer B, Robertson M, Vrana J, Jones K, Grotewold L, Smith A. Nanog safeguards pluripotency and mediates germline development. Nature. 2007;450:1230–1234. - PubMed

Publication types

MeSH terms

LinkOut - more resources