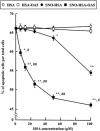
S-nitrosylated human serum albumin-mediated cytoprotective activity is enhanced by fatty acid binding
- PMID: 18940810
- PMCID: PMC2596408
- DOI: 10.1074/jbc.M807009200
S-nitrosylated human serum albumin-mediated cytoprotective activity is enhanced by fatty acid binding
Abstract
Binding of oleate to S-nitrosylated human serum albumin (SNO-HSA) enhances its cytoprotective effect on liver cells in a rat ischemia/reperfusion model. It enhances the antiapoptotic effect of SNO-HSA on HepG2 cells exposed to anti-Fas antibody. To identify some of the reasons for the increased cytoprotective effects, additional experiments were performed with glutathione and HepG2 cells. As indicated by 5,5'-dithiobis-2-nitrobenzoic acid binding, the addition of oleate increased the accessibility of the single thiol group of albumin. Binding of increasing amounts of oleate resulted in increasing and more rapid S-transnitrosation of glutathione. Likewise, binding of oleate, or of a mixture of endogenous fatty acids, improved S-denitrosation of SNO-HSA by HepG2 cells. Oleate also enhanced S-transnitrosation by HepG2 cells, as detected by intracellular fluorescence of diaminofluorescein-FM. All of the S-transnitrosation caused by oleate binding was blocked by filipin III. Oleate also increased, in a dose-dependent manner, the binding of SNO-HSA labeled with fluorescein isothiocyanate to the surface of the hepatocytes. A model in two parts was worked out for S-transnitrosation, which does not involve low molecular weight thiols. Fatty acid binding facilitates S-denitrosation of SNO-HSA, increases its binding to HepG2 cells and greatly increases S-transnitrosation by hepatocytes in a way that is sensitive to filipin III. A small nitric oxide transfer takes place in a slow system, which is unaffected by fatty acid binding to SNO-HSA and not influenced by filipin III. Thus, fatty acids could be a novel type of mediator for S-transnitrosation.
Figures


Similar articles
-
Modulation of the reactivity of the thiol of human serum albumin and its sulfenic derivative by fatty acids.Arch Biochem Biophys. 2012 May;521(1-2):102-10. doi: 10.1016/j.abb.2012.03.011. Epub 2012 Mar 19. Arch Biochem Biophys. 2012. PMID: 22450170 Free PMC article.
-
Albumin as a nitric oxide-traffic protein: characterization, biochemistry and possible future therapeutic applications.Drug Metab Pharmacokinet. 2009;24(4):308-17. doi: 10.2133/dmpk.24.308. Drug Metab Pharmacokinet. 2009. PMID: 19745558
-
One-step preparation of S-nitrosated human serum albumin with high biological activities.Nitric Oxide. 2010 Sep 15;23(2):121-7. doi: 10.1016/j.niox.2010.05.002. Epub 2010 May 6. Nitric Oxide. 2010. PMID: 20451647
-
Albumin-Based Nitric Oxide Traffic System for the Treatment of Intractable Cancers.Biol Pharm Bull. 2017;40(2):128-134. doi: 10.1248/bpb.b16-00867. Biol Pharm Bull. 2017. PMID: 28154250 Review.
-
[Human Serum Albumin as Carrier in Drug Delivery Systems].Yakugaku Zasshi. 2016;136(1):39-47. doi: 10.1248/yakushi.15-00227-1. Yakugaku Zasshi. 2016. PMID: 26725666 Review. Japanese.
Cited by
-
Redox-sensitivity and site-specificity of S- and N- denitrosation in proteins.PLoS One. 2010 Dec 21;5(12):e14400. doi: 10.1371/journal.pone.0014400. PLoS One. 2010. PMID: 21203591 Free PMC article.
-
The thiol pool in human plasma: the central contribution of albumin to redox processes.Free Radic Biol Med. 2013 Dec;65:244-253. doi: 10.1016/j.freeradbiomed.2013.05.050. Epub 2013 Jun 7. Free Radic Biol Med. 2013. PMID: 23747983 Free PMC article. Review.
-
Superoxide dismutase as a novel macromolecular nitric oxide carrier: preparation and characterization.Int J Mol Sci. 2012 Oct 29;13(11):13985-4001. doi: 10.3390/ijms131113985. Int J Mol Sci. 2012. PMID: 23203045 Free PMC article.
-
Modulation of the reactivity of the thiol of human serum albumin and its sulfenic derivative by fatty acids.Arch Biochem Biophys. 2012 May;521(1-2):102-10. doi: 10.1016/j.abb.2012.03.011. Epub 2012 Mar 19. Arch Biochem Biophys. 2012. PMID: 22450170 Free PMC article.
-
Recent advances in thromboresistant and antimicrobial polymers for biomedical applications: just say yes to nitric oxide (NO).Biomater Sci. 2016 Aug 19;4(8):1161-83. doi: 10.1039/c6bm00271d. Epub 2016 May 26. Biomater Sci. 2016. PMID: 27226170 Free PMC article. Review.
References
-
- Peters, T., Jr. (1996) All About Albumin: Biochemistry, Genetics, and Medical Applications, Academic Press, San Diego
-
- Dworschak, M., Franz, M., Hallstrom, S., Semsroth, S., Gasser, H., Haisjackl, M., Podesser, B. K., and Malinski, T. (2004) Pharmacology 72106 -112 - PubMed
-
- Hallstrom, S., Franz, M., Gasser, H., Vodrazka, M., Semsroth, S., Losert, U. M., Haisjackl, M., Podesser, B. K., and Malinski, T. (2008) Cardiovasc. Res. 77 506-514 - PubMed
-
- Hallstrom, S., Gasser, H., Neumayer, C., Fugl, A., Nanobashvili, J., Jakubowski, A., Huk, I., Schlag, G., and Malinski, T. (2002) Circulation 1053032 -3038 - PubMed
-
- Ishima, Y., Sawa, T., Kragh-Hansen, U., Miyamoto, Y., Matsushita, S., Akaike, T., and Otagiri, M. (2007) J. Pharmacol. Exp. Ther. 320969 -977 - PubMed
Publication types
MeSH terms
Substances
LinkOut - more resources
Full Text Sources
Research Materials
Miscellaneous

