Review
. 2008 Dec;29(7):823-64.
doi: 10.1210/er.2008-0005. Epub 2008 Oct 21.

Motivations and methods for analyzing pulsatile hormone secretion

Affiliations
Review

Motivations and methods for analyzing pulsatile hormone secretion

Johannes D Veldhuis et al. Endocr Rev. 2008 Dec.

Abstract

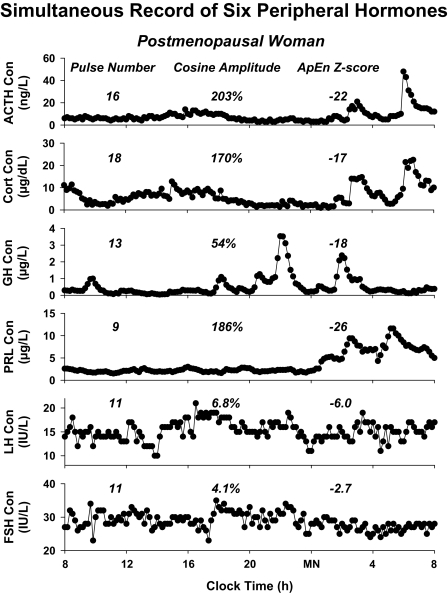
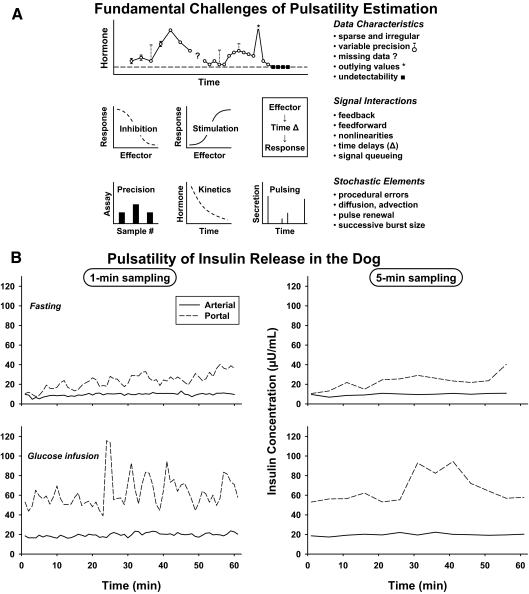
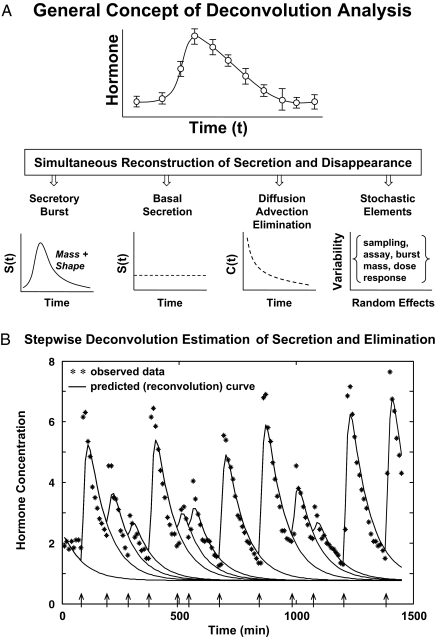
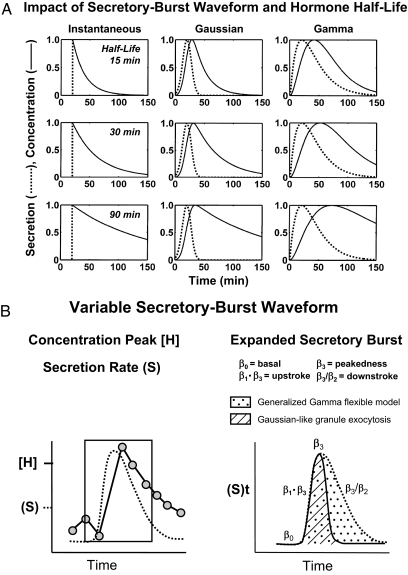
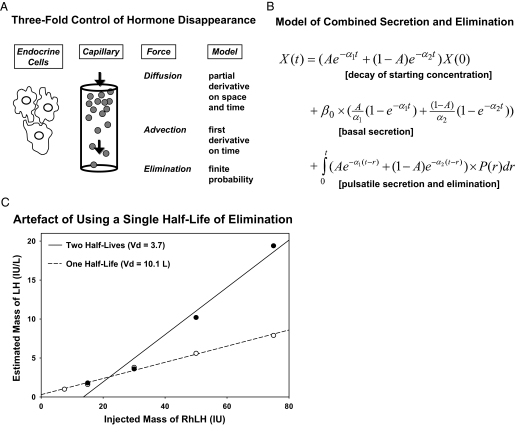
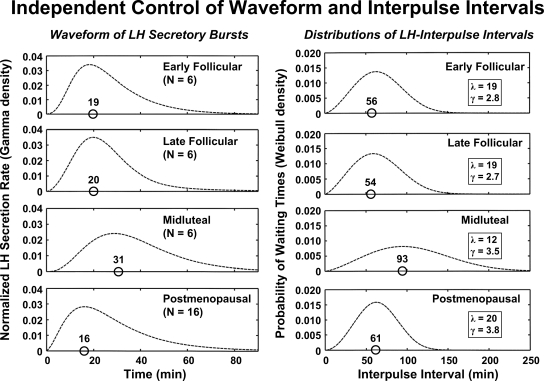
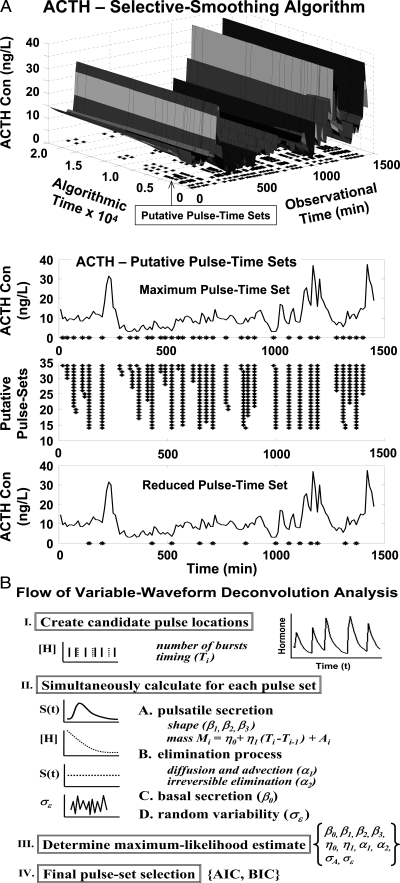
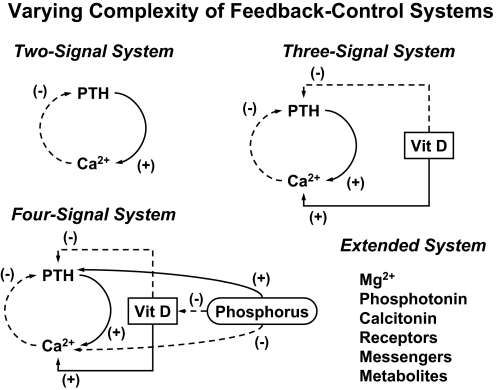
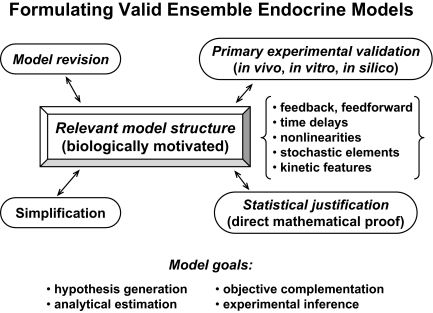
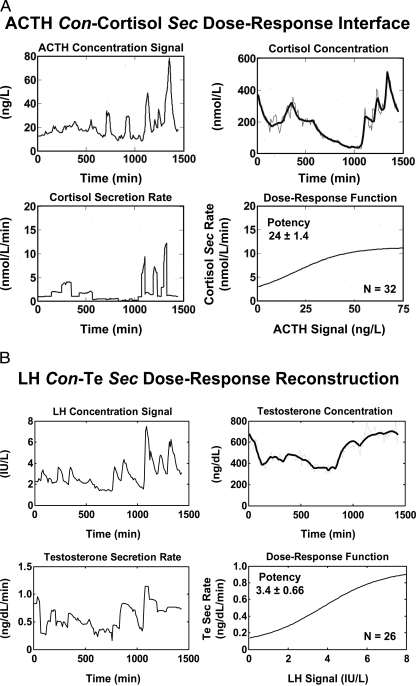
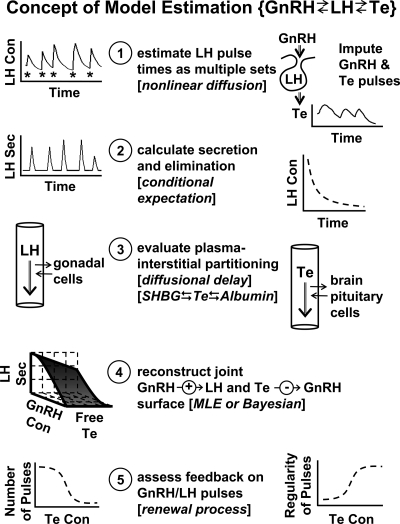
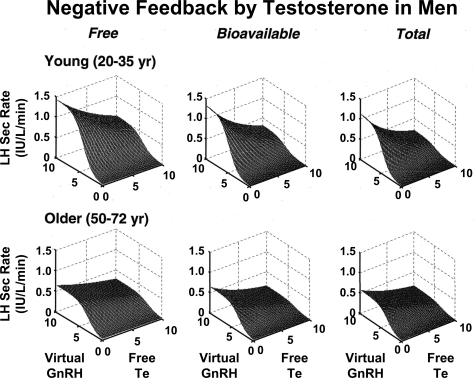
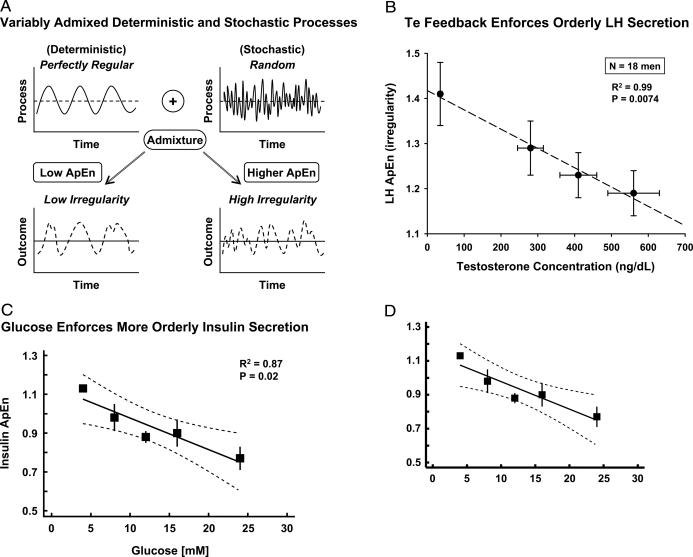
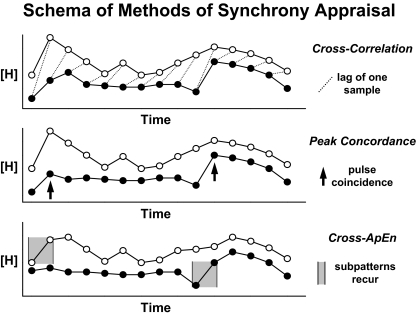
Endocrine glands communicate with remote target cells via a mixture of continuous and intermittent signal exchange. Continuous signaling allows slowly varying control, whereas intermittency permits large rapid adjustments. The control systems that mediate such homeostatic corrections operate in a species-, gender-, age-, and context-selective fashion. Significant progress has been made in understanding mechanisms of adaptive interglandular signaling in vivo. Principal goals are to understand the physiological origins, significance, and mechanisms of pulsatile hormone secretion. Key analytical issues are: 1) to quantify the number, size, shape, and uniformity of pulses, nonpulsatile (basal) secretion, and elimination kinetics; 2) to evaluate regulation of the axis as a whole; and 3) to reconstruct dose-response interactions without disrupting hormone connections. This review will focus on the motivations driving and the methodologies used for such analyses.


Figures

Figure 1
Figure 1
Diversity of pulsatility patterns exemplified by six hormone-concentration profiles obtained simultaneously in the same postmenopausal individual. Numerical values (above columns from left to right) are the number of pulses, the amplitude of the nycthemeral cosine rhythm (% of mean concentration), and relative orderliness defined by the ApEn z score (the absolute value denotes the number of standard deviates that observed ApEn is removed from mean ApEn of 1000 randomly shuffled versions of the same series). Thus, the prolactin pattern is highly regular (absolute z = 26), whereas that of FSH is nearly mean random (absolute z = 2.7). Hormone release was monitored by sampling blood every 10 min for 24 h. Cort, Cortisol; Con, concentration; PRL, prolactin. Data provided by Dr. Ferdinand Roelfsema, University of Leiden (Leiden, The Netherlands).
Figure 2
Figure 2
A, Schema of fundamental analytical hurdles associated with valid estimation of pulsatility. Challenges arise from inherent data limitations, nonlinear signal interactions, and confounding stochastic (random) effects. B, Diptych showing the impact of sampling time interval [1 min vs. 5 min] and sampling site [arterial vs. portal] on the appearance of insulin pulses.
Figure 3
Figure 3
Interactive model postulated to account for rapid SS, GHRH, and GH pulses within a volley driven by a primary arcuate-nucleus (ArC) oscillator (top). Resultant multipulse volleys of GH are quenched by GH’s autofeedback on the periventricular nucleus (PeV), thus creating a secondary slower oscillator (bottom right). The GH-releasing peptide, ghrelin, amplifies the size of GH pulses by opposing the inhibitory actions of SS on GHRH pulses within ArC and on GH release by somatotropes in the pituitary gland. [Adapted with permission from L. S. Farhy et al.: Am J Physiol Regul Integr Comp Physiol 292:R1577–R1593, 2007 (18).]
Figure 4
Figure 4
Schema of tetrapartite fate of LH-stimulated Te in plasma. Subscripted “K” values denote rate constants for exchange of Te with binding sites on plasma proteins, solubilization in plasma water, and irreversible elimination.
Figure 5
Figure 5
A, Principle of deconvolution analysis to decompose a hormone concentration peak (top) into an underlying secretory burst of finite mass and shape, basal secretion, an exponential elimination process, and random (stochastic) effects (bottom, left to right). B, One step in the interactive process of repeatedly estimating pulse amplitudes (continuous line) and hormone half-life (interrupted line) simultaneously to fit hormone data shown by the asterisks. Arrows depict putative pulse-onset times.
Figure 6
Figure 6
A, Simulated impact of half-life (top to bottom) and secretory-burst waveform (interrupted curves, left to right) and on the resultant shape of hormone-concentration peaks (continuous curves). Instantaneous secretion (delta function) yields a sharp peak, from which elimination half-lives may be estimated directly by exponential regression (left column). Symmetric Gaussian (middle) and asymmetric gamma (right) secretory bursts widen the peak and slow the descent of the concentration curve. B, Mathematical formulation of a flexible generalized gamma-probability model of secretory bursts. The three-parameter gamma waveform encompasses both rapid initial Gaussian-like (approximately time-symmetric) hormone release and delayed continuing (time-asymmetric) secretion. The three β parameters confer full flexibility of burst shape.
Figure 7
Figure 7
A, Fate of hormone molecules secreted into the bloodstream. Mathematical components comprise a partial derivative on space and time to define diffusion (random molecular motion in solution), a first derivative on time to reflect advection (linear blood flow due to cardiac action), and a finite elimination probability to denote irreversible removal or degradation. B, Combined equation system derived from the first principles of panel A. Any momentary concentration, X(t), arises from double-exponential elimination of starting concentrations, X(0), nonpulsatile basal secretion, β0, and pulsatile hormone secretion, P(r). C, Error in estimating the plasma Vd (slope of deconvolved LH mass regressed on injected LH mass) due to using a single-exponential rather than dual-exponential model of hormone elimination. Independent studies establish that Vd is approximately 3.5 liters for human LH (148).
Figure 8
Figure 8
Left, Analytically estimated LH secretory-burst waveform (shape) in six premenopausal women studied in the early and late follicular and midluteal phases of the menstrual cycle and 16 estrogen-deficient postmenopausal women. The waveform is the time evolution of the secretion rate within a burst, defined independently of mass by using a flexible generalized gamma probability distribution. Open circles and numbers on x-axes give the cohort mean secretory-burst mode (time latency to achieve maximal secretion). LH profiles were obtained by 10-min sampling for 24 h. Right, Interpulse-interval distributions in the same women. Lambda and gamma denote mean probabilistic pulse frequency (per 24 h) and interpulse regularity (unitless), respectively. [Adapted from D. M. Keenan et al.: Am J Physiol 285:E938–E948, 2003 (89).]
Figure 9
Figure 9
A, Concept of estimating multiple pulse-onset times by repeated incremental smoothing (nonlinear diffusion) of a hormone-concentration profile (top pictograph). Data are first detrended by the heat equation and normalized to the unit interval (0, 1) (data not shown). The incremental smoothing algorithm then gradually removes individual nadirs (points with least rapid subsequent increases) from the concentration time series (horizontal axis), leaving successive sets with one less pulse time each (asterisks). Thus, algorithmic cycles (oblique axis) create a family of decremental sets of potential pulse times, e.g., 34, 33, 32 … 3, 2, 1 pulse(s) per set. Columns of asterisks (middle section) show the locations of retained pulse onsets as a function of successive algorithmic runs. The maximum (starting) and a reduced candidate pulse set (bottom) are illustrated for a 10-min ACTH concentration profile. B, MLE of 10 simultaneous parameters of secretion and elimination statistically conditioned upon individual candidate pulse sets (step I, top). Pulse-mass random effects are reconstructed as conditional expectations evaluated at the MLE (steps II and III, middle). The final choice among multiple possible pulse-time sets is made by objective model-selection criteria, such as the AIC or BIC (step IV, bottom). Parameter asymptotics were verified by direct mathematical proof, and peak detection was validated by experimental paradigms (15,17,26,36).
Figure 10
Figure 10
Schema of ensemble feedback (−) and feedforward (+) interactions among PTH and calcium ions (top left), vitamin D (top right), phosphorus (bottom left), and other coregulators (bottom right). Unpublished line drawing.
Figure 11
Figure 11
Summary of key elements of ensemble (multipathway) endocrine models. The primary model structure (connections) should reflect known biology (central rectangle). Four main issues emerge, viz., model revision, validation, simplification, and verification. Goals of a valid models are highlighted below the figure.
Figure 12
Figure 12
Observed and estimated hormone-concentration and secretion pairs with simultaneously reconstructed dose-response functions encapsulating nonlinear feedforward. The pairs are ACTH concentrations (Con) driving cortisol secretion rates (Sec) (A), and analogously for LH concentrations feeding forward onto Te Sec (B). Each plot depicts data from one healthy adult. Cohort estimates of mean feedforward potencies (±sem) are stated (right lower panels) (N = number of subjects). [Adapted with permission from D. M. Keenan and J. D. Veldhuis: Am J Physiol 286:R381–R389, 2004 (34); and D. M. Keenan and J. D. Veldhuis: Am J Physiol 285:R950–R961, 2003 (35).]
Figure 13
Figure 13
Conceptual steps in analytical reconstruction of unobserved hypothalamic GnRH outflow, given measured serial concentrations of LH and Te and mean values of albumin and SHBG. Top, Identification of multiple potential LH pulse-time sets by incremental smoothing (nonlinear diffusion). Upper, Estimation of all secretion/elimination parameters conditional on a set of putative pulse-onset times. Middle, Nonequilibrium partitioning of Te into plasma diffusion, intravascular advection, protein binding, and irreversible elimination. Lower, Reconstruction of tripartite Te → LH feedback, Te → GnRH feedback, and GnRH → LH feedforward surface. Bottom, Inhibitory feedback by Te on number (Weibull lambda) or regularity (Weibull gamma) of LH pulses. [Derived from Ref. .]
Figure 14
Figure 14
Analytical estimation of age cohort-defined three-dimensional surfaces relating LH secretion (vertical axis) to estimated GnRH outflow (oblique axis) and free Te (left), bioavailable Te (middle), and total Te (right) concentrations (horizontal axes). Data are from 10 young and 8 older men. [Reproduced with permission from D. M. Keenan et al.: Endocrinology 147:2817–2828, 2006 (17).]
Figure 15
Figure 15
A, Concept of ApEn statistic, a measure of relative process randomness (irregularity). ApEn distinguishes subtle differences in regularity, orderliness, or reproducibility of subpatterns in sequential measurements. Low ApEn denotes more orderly and less random (irregular) contributions to the signaling pattern. Conversely, high ApEn signifies more irregular or apparently “random” inputs. High ApEn characterizes hormone secretion patterns associated with autonomous endocrine tumors, low feedback states, aging individuals, and fixed exogenous stimulation of hormone output. B and C, Exogenously imposed negative feedback by Te onto LH secretion and by glucose onto insulin secretion. The fall in ApEn with higher feedback-signal concentrations denotes greater regularity of LH and insulin secretion. [Adapted with permission from P. Y. Liu et al.: J Clin Endocrinol Metab 91:4077–4084, 2006 (240).]
Figure 16
Figure 16
Schematic representation of three methods to quantify pairwise synchrony of hormone time series. The techniques give complementary insights into coordinate control. In particular, cross-correlation is linear and lag-specific (top); discrete peak coincidence is probabilistic and lag-specific (middle); and cross-ApEn is a scale-, model-, and lag-free joint synchrony measure (bottom).

Similar articles

Cited by

References

    1. Urban RJ, Evans WS, Rogol AD, Kaiser DL, Johnson ML, Veldhuis JD 1988 Contemporary aspects of discrete peak detection algorithms. I. The paradigm of the luteinizing hormone pulse signal in men. Endocr Rev 9:3–37 - PubMed
    1. Evans WS, Sollenberger MJ, Booth Jr RA, Rogol AD, Urban RJ, Carlsen EC, Johnson ML, Veldhuis JD 1992 Contemporary aspects of discrete peak detection algorithms. II. The paradigm of the luteinizing hormone pulse signal in women. Endocr Rev 13:81–104 - PubMed
    1. Giustina A, Veldhuis JD 1998 Pathophysiology of the neuroregulation of growth hormone secretion in experimental animals and the human. Endocr Rev 19:717–797 - PubMed
    1. Veldhuis JD, Roemmich JN, Richmond EJ, Bowers CY 2006 Somatotropic and gonadotropic axes linkages in infancy, childhood, and the puberty-adult transition. Endocr Rev 27:101–140 - PubMed
    1. Keenan DM, Veldhuis JD 2003 Mathematical modeling of receptor-mediated interlinked systems. Encyclopedia of hormones. San Diego: Academic Press; 286–294

Publication types