. 2008 Oct 28;105(43):16797-802.
doi: 10.1073/pnas.0806159105. Epub 2008 Oct 21.

Delayed plasticity of inhibitory neurons in developing visual cortex

Affiliations

Delayed plasticity of inhibitory neurons in developing visual cortex

Sunil P Gandhi et al. Proc Natl Acad Sci U S A. .

Abstract

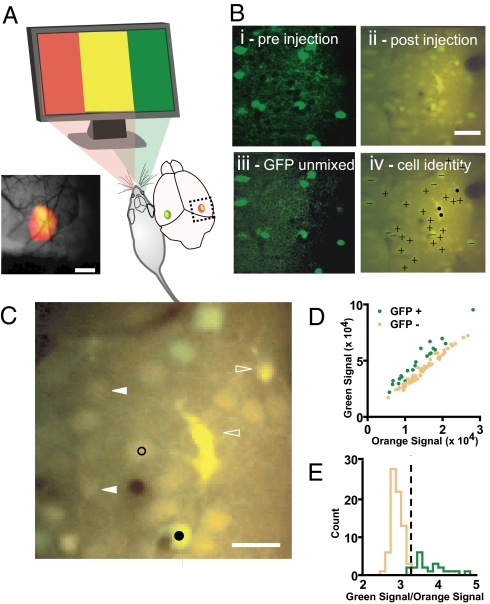
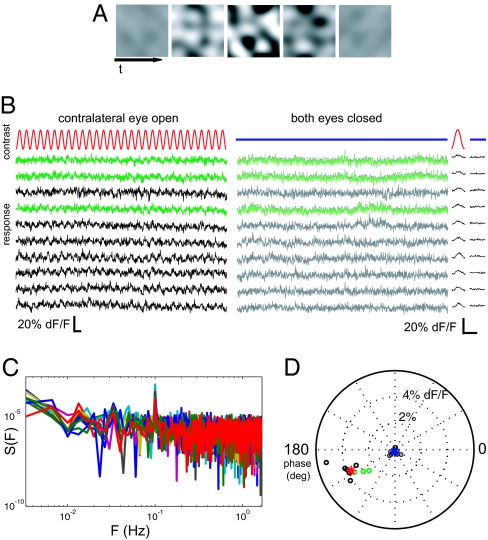
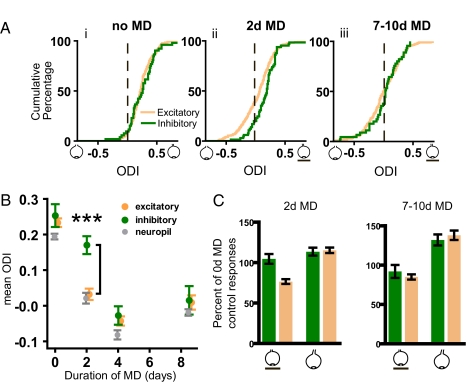
During postnatal development, altered sensory experience triggers the rapid reorganization of neuronal responses and connections in sensory neocortex. This experience-dependent plasticity is disrupted by reductions of intracortical inhibition. Little is known about how the responses of inhibitory cells themselves change during plasticity. We investigated the time course of inhibitory cell plasticity in mouse primary visual cortex by using functional two-photon microscopy with single-cell resolution and genetic identification of cell type. Initially, local inhibitory and excitatory cells had similar binocular visual response properties, both favoring the contralateral eye. After 2 days of monocular visual deprivation, excitatory cell responses shifted to favor the open eye, whereas inhibitory cells continued to respond more strongly to the deprived eye. By 4 days of deprivation, inhibitory cell responses shifted to match the faster changes in their excitatory counterparts. These findings reveal a dramatic delay in inhibitory cell plasticity. A minimal linear model reveals that the delay in inhibitory cell plasticity potently accelerates Hebbian plasticity in neighboring excitatory neurons. These findings offer a network-level explanation as to how inhibition regulates the experience-dependent plasticity of neocortex.


Conflict of interest statement

The authors declare no conflict of interest.

Figures

Fig. 1.
Fig. 1.
Identifying inhibitory neurons in the binocular primary visual cortex. (A) Intrinsic signal optical imaging reveals the binocular zone of mouse primary visual cortex. Response maps to contralateral eye (in red) and ipsilateral eye (in green) visual stimulation are superimposed. The region of binocular overlap appears as yellow. Subsequent calcium indicator labeling and recording were targeted to the medial half of the mapped binocular region, corresponding to primary visual cortex. (Scale bar: 0.8 mm.) (B) Fluorescent signals from GFP-positive inhibitory cells and bulk-loaded calcium indicators are separable. Single plane imaged in two color channels from visual cortex of a mouse line expressing GFP in inhibitory neurons shown before (i) and after (ii) the extracellular loading of calcium indicator. GFP-positive cells stand out from neuropil and GFP-negative cells. (iii) GFP fluorescence is linearly separable from calcium indicator fluorescence after indicator loading. (iv) Merged image from ii annotated with + symbols for excitatory neurons, − for inhibitory neurons, and ● for astroglia. (Scale bar: 40 μm.) (C) Selection of pixels used to measure responses of individual neurons. Circular pixel selections 4 μm wide (examples shown in black; filled is inhibitory and open is excitatory) were drawn within the boundaries of each cell body to guarantee exclusion of neuropil signal contamination. Cell bodies that were poorly sectioned (filled triangles) as well as morphologically identified astroglia (open triangles) were excluded from analysis. (Scale bar: 20 μm.) (D and E) Neurons identified as GFP-positive before indicator loading (green) are discriminated from GFP-negative neurons (orange) by the ratio of green to orange fluorescence intensity. A discriminator partitions the GFP-positive from GFP-negative neurons (dashed line in E).
Fig. 2.
Fig. 2.
Measuring cell responses to monocular visual stimulation. (A) Contrast modulated stochastic noise visual stimulus. A grayscale movie, modulating sinusoidally between zero and maximal contrast with a 10-s period, was presented separately to each eye (Movie S1 (AVI)). The noise stimulus contained spatial and temporal components tailored to the selectivity of mouse primary visual cortical neurons. (B) Example cellular calcium signal traces from 10 simultaneously recorded neurons during 30 cycles of the noise stimulus presented to one eye only (Left), or with both eyes occluded (Right). Recordings from inhibitory neurons are in green. Time average of 30 cycles plotted for each stimulation condition (far right) shows a periodic response to monocular stimulation in all cells. Scale bars are 20 s (Left) and 10 s (Right). (C) Power spectra of responses to contralateral stimulation show a peak at the fundamental frequency of contrast modulation. (D) Responses to visual stimulation are well separated from nonstimulated condition. Shown is a polar plot of the phase and amplitude of the best-fitting sinusoid of period 10 s for each of the cells above in stimulated (open circles) and unstimulated control (filled circles) conditions. Red and blue asterisks indicate the mean response across cells for the stimulated and nonstimulated conditions, respectively. Green circles indicate inhibitory cell responses.
Fig. 3.
Fig. 3.
Monocular deprivation affects excitatory cell responses faster than inhibitory cell responses. (A) For each cell, an eye dominance index was computed from the responses to monocular stimulation. The index ranges from −1 for neurons driven exclusively by the ipsilateral eye to +1 for those driven exclusively by the contralateral eye. (i) The ODI distributions of inhibitory and excitatory cells responses are similarly biased toward the contralateral eye (K-S test, D = 0.1356, P = 0.382; nexc = 253, ninh = 52). (ii) After 2 days of monocular visual deprivation (MD) of the contralateral eye, excitatory and inhibitory cell distributions are no longer matched (K-S test, D = 0.246, P = 0.002; nexc = 333, ninh = 71). (iii) After 7–10 days of deprivation, the two populations are matched again (K-S test, D = 0.1605, P = 0.276; nexc = 206, ninh = 45). (B) Effect of length of MD on mean ODI for excitatory and inhibitory cells, as well as for the neuropil. Only at 2 days were the inhibitory and excitatory populations significantly different (Mann–Whitney test, U = 7957, P < 0.0001) as a result of the rapid change in excitatory but not in inhibitory cells. Contamination by neuropil responses cannot account for the delay seen in inhibitory cell plasticity. Error bars reflect standard error of mean. (C) (Left) Comparison of the median responses from excitatory and inhibitory cells after 2 days of MD, each normalized by the median responses from the control group with no MD. The responses of excitatory cells to the deprived eye are selectively reduced, whereas the deprived-eye responses of inhibitory cells and the open-eye responses in inhibitory and excitatory cells are largely unchanged. (Right) After 7–10 d of MD, responses in excitatory cells are similar to those of inhibitory cells, no matter which eye is stimulated. Error bars reflect standard error of the median, obtained by bootstrap estimation.
Fig. 4.
Fig. 4.
Possible impact of delayed inhibitory cell plasticity. (A) A minimal arrangement of connections to inhibitory and excitatory cells in the upper layers of visual cortex during the critical period that is consistent with our findings and refs. –. Initially, inhibitory and excitatory cells receive similar patterns of inputs from the deprived eye (de = di) and from the open eye (oe = oi). Local excitatory connections onto inhibitory neurons (ei) are not prominent in developing visual cortex. (B) A minimal model of Hebbian synaptic modification after monocular deprivation recapitulates the delayed plasticity of inhibitory neurons observed experimentally. On visual deprivation of the contralateral eye, deprived-eye responses from excitatory cells decrease quickly, whereas deprived-eye responses from inhibitory cells fall more slowly. Increasing the strength of local inhibition (ie) alone potently accelerates excitatory cell changes, even when the cell-intrinsic rates of change are equal.

References

    1. Wiesel TN, Hubel DH. Single-cell responses in striate cortex of kittens deprived of vision in one eye. J Neurophysiol. 1963;26:1003–1017. - PubMed
    1. Trachtenberg JT, Trepel C, Stryker MP. Rapid extragranular plasticity in the absence of thalamocortical plasticity in the developing primary visual cortex. Science. 2000;287:2029–2032. - PMC - PubMed
    1. Hensch TK, et al. Local GABA circuit control of experience-dependent plasticity in developing visual cortex. Science. 1998;282:1504–1508. - PMC - PubMed
    1. Fagiolini M, Hensch TK. Inhibitory threshold for critical-period activation in primary visual cortex. Nature. 2000;404:183–186. - PubMed
    1. Huang ZJ, et al. BDNF regulates the maturation of inhibition and the critical period of plasticity in mouse visual cortex. Cell. 1999;98:739–755. - PubMed

Publication types

LinkOut - more resources