. 2008 Oct 28;105(43):16719-24.
doi: 10.1073/pnas.0803504105. Epub 2008 Oct 21.

Hec1 overexpression hyperactivates the mitotic checkpoint and induces tumor formation in vivo

Affiliations

Hec1 overexpression hyperactivates the mitotic checkpoint and induces tumor formation in vivo

Elena Diaz-Rodríguez et al. Proc Natl Acad Sci U S A. .

Abstract

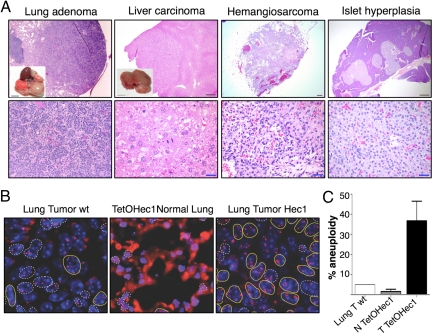
Hec1 (Highly Expressed in Cancer 1) is one of four proteins of the outer kinetochore Ndc80 complex involved in the dynamic interface between centromeres and spindle microtubules. Its overexpression is seen in a variety of human tumors and correlates with tumor grade and prognosis. We show here that the overexpression of Hec1 in an inducible mouse model results in mitotic checkpoint hyperactivation. As previously observed with overexpression of the Mad2 gene, hyperactivation of the mitotic checkpoint leads to aneuploidy in vitro and is sufficient to generate tumors in vivo that harbor significant levels of aneuploidy. These results underscore the role of chromosomal instability as a result of mitotic checkpoint hyperactivation in the initiation of tumorigenesis.


Conflict of interest statement

The authors declare no conflict of interest.

Figures

Fig. 1.
Fig. 1.
Generation and characterization of a panHec1 antibody. (A) HeLa or 3T3 cell extracts were separated by SDS/PAGE and Western-blotted with the anti-hHec1 (Lower) or the panHec1 antibody (Upper). (B) The panHec1 antibody immunoprecipitated a band of the expected size in both HeLa and murine 3T3 cells. The anti-hHec1 antibody used as a positive control was raised in mouse. HC, heavy chain. (C) Immunofluorescence with purified anti-panHec1 antibody in WT MEFs. White arrows indicate centrosomes, and yellow arrows indicate kinetochores. (Magnification: C, × 63.)
Fig. 2.
Fig. 2.
Generation and characterization of pTRE-Hec1 overexpression vector. (A) Diagram of the transgene construct used to overexpress Hec1. TetO, tetracycline operator; HA, hemagglutinin; poly(A), SV40 gene polyadenylation sequence. (B) Empty vector (pTRE) or pTRE-HAmHec1 were transfected in HeLa-Tet-Off cells, and fold increments of doxycycline added to repress transgene expression. (C) (Left) Immunofluorescence of exogenous mHec1 stained both kinetochores and centrosomes of a mitotic cell. panHec1 antibody, red; DNA, blue. (Center) panHec1 stained the centrosomes of an interphase cell. (Right) Immunofluorescence of the competed antibody. White arrows indicate centrosomes, and yellow arrows indicate kinetochores. (D) PCR of tail DNA confirming the presence of mHec1 transgene in different founders and Southern blot of genomic DNA using a transgene-specific probe. C: control. (Magnification: C, × 63.)
Fig. 3.
Fig. 3.
In vivo expression of TetO-Hec1. (A) RT-PCR from different tissues of nontransgenic mice and TetO-Hec1/CMV-rtTA mice exposed to doxycycline from 4 weeks to harvest at 8 weeks or exposed to doxycycline for 4 weeks and then to normal food for 3 weeks. PCRs were carried out in the presence (Top) and absence (Middle) of reverse transcription. Amplification of GADPH mRNA confirmed the presence of RNA in all samples (Bottom). (B) Western blot analysis showing Hec1 protein expression in testis (Left), kidney (Center), and MEFs (Right) from nontransgenic animals (N Tg) or TetO-Hec1/CMV-rtTA exposed to doxycycline (ON) or released from it (OFF). (C) Immunofluorescence of G2-M MEFs showing HAmHec1 localization to spindle poles and kinetochores (DNA, blue; mHec, red; γ-tubulin, green). (D) Diffuse localization of mHec1 in induced MEFs by immunofluorescence in G1-S cells. White arrows indicate centrosomes. (E) Mitotic index of asynchronous cells and cells synchronized by serum starvation. At least 2,000 cells of each condition were counted. (Magnification: C and D, × 63.)
Fig. 4.
Fig. 4.
Characterization of Hec1-overexpressing primary cells. (A) Percentage of aneuploidy in the 2N and 4N population in TetO-Hec1-overexpressing (n = 128) and control MEFs (n = 78). (B) Evidence of lagging chromosomes and chromosome bridges in TetO-Hec1/CMV-rtTA-induced MEFs. (C) Example of a normal spindle in control cells and aberrant spindles in TetO-Hec1/CMV-rtTA-induced MEFs. (D) Western blot analysis of in vitro-stimulated splenic lymphocytes isolated from a nontransgenic and two different TetO-Hec1/CMV-rtTA mice in the presence of doxycycline showing the expression of Hec1 and the stabilization of Mad2 and Securin. (Magnification: C, × 63.)
Fig. 5.
Fig. 5.
Hec1 overexpression induces tumor formation in vivo. (A) H&E staining of indicated tumors found in Hec1 transgenic animals taken at low (Upper) or high (Lower) magnification. (Insets) Macroscopic pictures of some of the tumors are shown. (Scale bars: Inset, 1 cm; black bar, 300 μm; blue bar, 30 μm.) (B) FISH images of lung sections from a WT tumor, a nontumor Hec1 lung, and a lung tumor from a Hec1-overexpressing animal showing aneuploidy in the later. DNA is shown in blue, and FISH paint probe to chromosome 12 is in red. Yellow circles mark aneuploid cells, and white circles are diploid cells. (C) Percentage of aneuploidy in a spontaneous WT lung tumor, normal lung overexpressing Hec1, and lung tumors from Hec1 mice. At least 80 cells were counted per condition. (Magnification: C, × 63.)

Similar articles

Cited by

References

    1. Bharadwaj R, Yu H. The spindle checkpoint, aneuploidy, and cancer. Oncogene. 2004;23:2016–2027. - PubMed
    1. Wassmann K, Benezra R. Mitotic checkpoints: From yeast to cancer. Curr Opin Genet Dev. 2001;11:83–90. - PubMed
    1. Ciferri C, Musacchio A, Petrovic A. The Ndc80 complex: Hub of kinetochore activity. FEBS Lett. 2007;581:2862–2869. - PubMed
    1. Cheeseman IM, Chappie JS, Wilson-Kubalek EM, Desai A. The conserved KMN network constitutes the core microtubule-binding site of the kinetochore. Cell. 2006;127:983–997. - PubMed
    1. DeLuca JG, et al. Kinetochore microtubule dynamics and attachment stability are regulated by Hec1. Cell. 2006;127:969–982. - PubMed

Publication types

MeSH terms