Birdsong "transcriptomics": neurochemical specializations of the oscine song system
- PMID: 18941504
- PMCID: PMC2563692
- DOI: 10.1371/journal.pone.0003440
Birdsong "transcriptomics": neurochemical specializations of the oscine song system
Abstract
Background: Vocal learning is a rare and complex behavioral trait that serves as a basis for the acquisition of human spoken language. In songbirds, vocal learning and production depend on a set of specialized brain nuclei known as the song system.
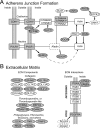
Methodology/principal findings: Using high-throughput functional genomics we have identified approximately 200 novel molecular markers of adult zebra finch HVC, a key node of the song system. These markers clearly differentiate HVC from the general pallial region to which HVC belongs, and thus represent molecular specializations of this song nucleus. Bioinformatics analysis reveals that several major neuronal cell functions and specific biochemical pathways are the targets of transcriptional regulation in HVC, including: 1) cell-cell and cell-substrate interactions (e.g., cadherin/catenin-mediated adherens junctions, collagen-mediated focal adhesions, and semaphorin-neuropilin/plexin axon guidance pathways); 2) cell excitability (e.g., potassium channel subfamilies, cholinergic and serotonergic receptors, neuropeptides and neuropeptide receptors); 3) signal transduction (e.g., calcium regulatory proteins, regulators of G-protein-related signaling); 4) cell proliferation/death, migration and differentiation (e.g., TGF-beta/BMP and p53 pathways); and 5) regulation of gene expression (candidate retinoid and steroid targets, modulators of chromatin/nucleolar organization). The overall direction of regulation suggest that processes related to cell stability are enhanced, whereas proliferation, growth and plasticity are largely suppressed in adult HVC, consistent with the observation that song in this songbird species is mostly stable in adulthood.
Conclusions/significance: Our study represents one of the most comprehensive molecular genetic characterizations of a brain nucleus involved in a complex learned behavior in a vertebrate. The data indicate numerous targets for pharmacological and genetic manipulations of the song system, and provide novel insights into mechanisms that might play a role in the regulation of song behavior and/or vocal learning.
Conflict of interest statement
Figures



Similar articles
-
The constitutive differential transcriptome of a brain circuit for vocal learning.BMC Genomics. 2018 Apr 3;19(1):231. doi: 10.1186/s12864-018-4578-0. BMC Genomics. 2018. PMID: 29614959 Free PMC article.
-
Inter- and intra-specific differences in muscarinic acetylcholine receptor expression in the neural pathways for vocal learning in songbirds.J Comp Neurol. 2018 Dec 1;526(17):2856-2869. doi: 10.1002/cne.24532. Epub 2018 Oct 19. J Comp Neurol. 2018. PMID: 30198559
-
Molecular characterization of the song control nucleus HVC in Bengalese finch brain.Brain Res. 2010 Nov 11;1360:56-76. doi: 10.1016/j.brainres.2010.09.014. Epub 2010 Sep 21. Brain Res. 2010. PMID: 20846513
-
A species-specific view of song representation in a sensorimotor nucleus.J Physiol Paris. 2013 Jun;107(3):193-202. doi: 10.1016/j.jphysparis.2012.08.004. Epub 2012 Aug 30. J Physiol Paris. 2013. PMID: 22960663 Review.
-
Birth, migration, incorporation, and death of vocal control neurons in adult songbirds.J Neurobiol. 1997 Nov;33(5):585-601. J Neurobiol. 1997. PMID: 9369461 Review.
Cited by
-
Genome of a songbird unveiled.J Biol. 2010;9(3):19. doi: 10.1186/jbiol222. Epub 2010 Apr 1. J Biol. 2010. PMID: 20359317 Free PMC article. Review.
-
Accelerated evolution of PAK3- and PIM1-like kinase gene families in the zebra finch, Taeniopygia guttata.Mol Biol Evol. 2010 Aug;27(8):1923-34. doi: 10.1093/molbev/msq080. Epub 2010 Mar 17. Mol Biol Evol. 2010. PMID: 20237222 Free PMC article.
-
Brinp1(-/-) mice exhibit autism-like behaviour, altered memory, hyperactivity and increased parvalbumin-positive cortical interneuron density.Mol Autism. 2016 Mar 31;7:22. doi: 10.1186/s13229-016-0079-7. eCollection 2016. Mol Autism. 2016. PMID: 27042284 Free PMC article.
-
Specialized motor-driven dusp1 expression in the song systems of multiple lineages of vocal learning birds.PLoS One. 2012;7(8):e42173. doi: 10.1371/journal.pone.0042173. Epub 2012 Aug 2. PLoS One. 2012. PMID: 22876306 Free PMC article.
-
Dynamic transcriptome landscape in the song nucleus HVC between juvenile and adult zebra finches.Adv Genet (Hoboken). 2021 Jan 6;2(1):e10035. doi: 10.1002/ggn2.10035. eCollection 2021 Mar. Adv Genet (Hoboken). 2021. PMID: 36618441 Free PMC article.
References
-
- Rho JY, Wada-Kiyama Y, Onishi Y, Kiyama R, Sakuma Y. Expressional regulation of neuronal and cancer-related genes by estrogen in adult female rats. Endocr Res. 2004;30:257–267. - PubMed
-
- Torres-Munoz JE, Van Waveren C, Keegan MG, Bookman RJ, Petito CK. Gene expression profiles in microdissected neurons from human hippocampal subregions. Brain Res Mol Brain Res. 2004;127:105–114. - PubMed
-
- Lomax MI, Huang L, Cho Y, Gong TL, Altschuler RA. Differential display and gene arrays to examine auditory plasticity. Hear Res. 2000;147:293–302. - PubMed
-
- Takita J, Ishii M, Tsutsumi S, Tanaka Y, Kato K, et al. Gene expression profiling and identification of novel prognostic marker genes in neuroblastoma. Genes Chromosomes Cancer. 2004;40:120–132. - PubMed
-
- Malyala A, Pattee P, Nagalla SR, Kelly MJ, Ronnekleiv OK. Suppression subtractive hybridization and microarray identification of estrogen-regulated hypothalamic genes. Neurochem Res. 2004;29:1189–1200. - PubMed
Publication types
MeSH terms
Grants and funding
LinkOut - more resources
Full Text Sources
Research Materials
Miscellaneous

