. 2008;3(10):e3456.
doi: 10.1371/journal.pone.0003456. Epub 2008 Oct 20.

Origination of the split structure of spliceosomal genes from random genetic sequences

Affiliations

Origination of the split structure of spliceosomal genes from random genetic sequences

Rahul Regulapati et al. PLoS One. 2008.

Abstract

The mechanism by which protein-coding portions of eukaryotic genes came to be separated by long non-coding stretches of DNA, and the purpose for this perplexing arrangement, have remained unresolved fundamental biological problems for three decades. We report here a plausible solution to this problem based on analysis of open reading frame (ORF) length constraints in the genomes of nine diverse species. If primordial nucleic acid sequences were random in sequence, functional proteins that are innately long would not be encoded due to the frequent occurrence of stop codons. The best possible way that a long protein-coding sequence could have been derived was by evolving a split-structure from the random DNA (or RNA) sequence. Results of the systematic analyses of nine complete genome sequences presented here suggests that perhaps the major underlying structural features of split-genes have evolved due to the indigenous occurrence of split protein-coding genes in primordial random nucleotide sequence. The results also suggest that intron-rich genes containing short exons may have been the original form of genes intrinsically occurring in random DNA, and that intron-poor genes containing long exons were perhaps derived from the original intron-rich genes.


Conflict of interest statement

Competing Interests: The authors have declared that no competing interests exist.

Figures

Figure 1
Figure 1. The probability of ORFs of increasing lengths.
The probability of ORFs of increasing lengths was calculated based on the formula P (ORFn) = (61/64)n, where n is the ORF length in codons. The Expected Mean Length (EML) for the random DNA for the chance occurrence of ORFn is n times the reciprocal of the probability.
Figure 2
Figure 2. Frequency distributions of ORF lengths in random and eukaryotic DNA.
The ORF lengths in all six RFs in a computer generated random DNA sequence (100,000 bases) and in the human genomic sequence [H. sapiens chromosome 1, reference: NT_ 004350.18: base 48,000,000 to base 48,100,000] were computed and the ORF length frequencies and the cumulative frequencies were plotted.
Figure 3
Figure 3. Frequency distributions of ORF lengths in complete eukaryotic and prokaryotic genomes.
The ORF lengths in the six RFs of the complete eukaryotic genomes H. sapiens (A), A. thaliana, D. melanogaster, and C. elegans (B), P. falciparum, S. pombe and S. cerevisia (C), and the prokaryotic genomes E. coli K12 and S. pneumoniae R6 (D) were computed and the frequency distributions were plotted. Only frequencies up to 750 bases in length were plotted. The ARF lengths were computed using the amino-acid codons GAC, ACT, CTG (A). The ORF length frequencies were also computed in a computer generated random DNA of length and base composition (See Methods) that matched the respective genomes (B, C, D).
Figure 4
Figure 4. Direct correlation of the number of exons per gene, length of coding sequence, and length of gene.
The number of exons, length of coding sequence, and length of gene for each gene in the human genome were tabulated from the EuSplice database . The number of genes with specified number of exons was recorded, and the average lengths of the coding sequence and the gene for this dataset were computed. The average lengths of the coding sequence and the gene were plotted as a function of increasing number of exons per gene up to 80 exons per gene. The figure shows (A) length of coding sequence and (B) length of gene as a function of increasing number of exons per gene.
Figure 5
Figure 5. Specific generation of non-conforming ORFs due to exon splicing.
(A) Human genes with a complete coding sequence (spliced-exons) >2000 bases and a gene sequence devoid of ORFs >750 bases were selected. The ORF and ARF lengths were computed in all three RFs of each of these genes, and their combined frequencies were plotted. The frequencies of the lengths of exons from this set of genes were also plotted. Next, the exons from each gene were spliced to form its coding sequence and the frequency distribution of ORF and ARF lengths from the spliced sequences were plotted. The X-axis was broken into two parts: from 0–749 bases and from 750–10000 bases. The Y-axis scales corresponding to 0–749 bases are shown on the left, and those corresponding to 750–10000 bases are shown on the right. The frequencies corresponding to 0–749 bases were binned for every 6 consecutive ORF/ARF/exon lengths and the frequencies corresponding to 750–10000 bases were binned every 100 consecutive ORF/ARF lengths. (B) Frequency distribution of ORF lengths in prokaryotic genes. All the genes from the E. coli K12 genome, each of whose coding sequence length was at least 2000 bases, were selected. The ORF lengths in all three RFs of each of these genes were computed and their combined frequencies plotted. The ORF length frequency from the spliced sequences of the >2000 base human gene set (Figure 3A) was overlaid for comparison. The methods used for line break, binning and plotting are the same as in Figure 3A.
Figure 6
Figure 6. Frequency distributions of the lengths of ORFs, exons, and coding-sequence of genes from different genomes.
The frequency distributions of the lengths of exons and the complete coding sequence of genes and the ORFs from the genomes of H. sapiens (A), A. thaliana (B), C. elegans (C), D. melanogaster (D), P. falciparum (E), and combined fungal genomes of S. pombe and S. cerevisia (F), and the lengths of the coding sequence of genes and ORFs from the combined prokaryotic genomes of E. coli K12 and S. pneumoniae R6 (G) were plotted. Frequencies of every 100 consecutive ORF lengths were binned. The frequencies of the TCSs are shown on the left Y-axis and the frequencies of the ORFs and exons are shown on the right Y-axis. In order to magnify the frequencies within the region of non-randomness, the frequencies above certain threshold values (250 and 500 respectively for left and right Y-axes) are not shown, as the frequencies of only ORFs/exons of very short lengths exhibit such large frequencies (Figure 2).
Figure 7
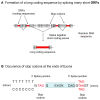
Figure 7. The ROSG model.
According to the ROSG model, mRNA splicing evolved to overcome the problem of the frequent occurrence of stop codons in primordial random DNA that severely restricted ORF lengths. (A) Stop codons occurred too frequently to allow functional proteins to be encoded in random DNA. Long contiguous coding sequences were made by the splicing together of short coding-pieces occurring within short ORFs (which became exons) and the elimination of the intervening random sequences (which became introns). (B) Consistent with this model, stop codons are present at exon borders at uniquely high frequencies. The majority of the codons that border the 3′ end of exons are stop codons and all three stop-codons occur at this position (Table S1). Meanwhile one stop-codon (TAG) is predominant at the 5′ end.

Similar articles

Cited by

References

    1. Roy SW, Gilbert W. The evolution of spliceosomal introns: patterns, puzzles and progress. Nature Rev Genet. 2006;7:211–221. - PubMed
    1. Roy SW, Gilbert W. Complex early genes. Proc Natl Acad Sci U S A. 2005;102:1986–1991. - PMC - PubMed
    1. Roy SW, Gilbert W. Rates of intron loss and gain: implications for early eukaryotic evolution. Proc Natl Acad Sci U S A. 2005;102:5773–5778. - PMC - PubMed
    1. Rogozin IB, Wolf YI, Sorokin AV, Mirkin BG, Koonin EV. Remarkable interkingdom conservation of intron positions and massive, lineage-specific intron loss and gain in eukaryotic evolution. Curr Biol. 2003;13:1512–1517. - PubMed
    1. Roy SW, Fedorov A, Gilbert W. Large-scale comparison of intron positions in mammalian genes shows intron loss but no gain. Proc Natl Acad Sci U S A. 2003;100:7158–7162. - PMC - PubMed

Publication types