. 2009 Jun;58(6):877-86.
doi: 10.1007/s00262-008-0603-5. Epub 2008 Oct 22.

The immunosuppressive tumor microenvironment in hepatocellular carcinoma

Affiliations

The immunosuppressive tumor microenvironment in hepatocellular carcinoma

Yan-Li Pang et al. Cancer Immunol Immunother. 2009 Jun.

Abstract

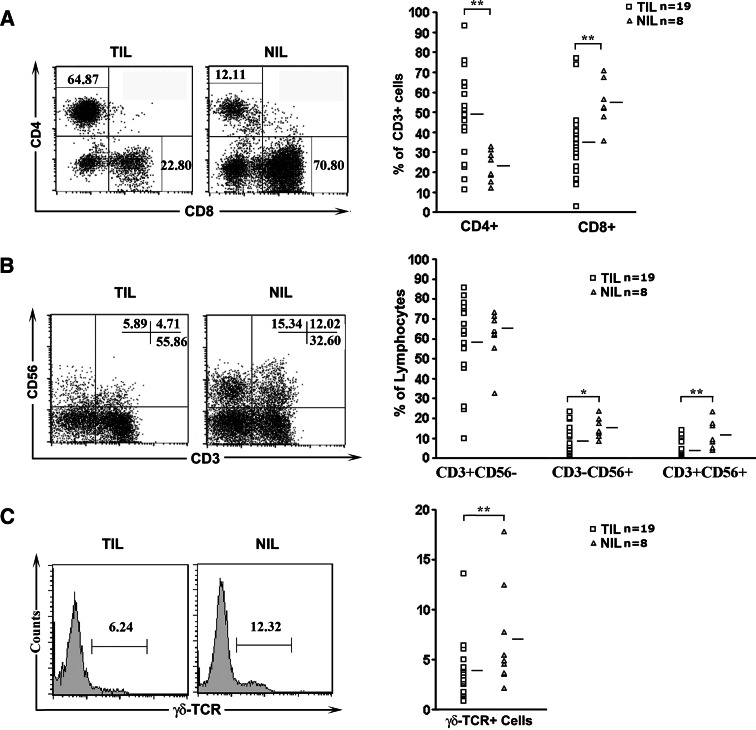
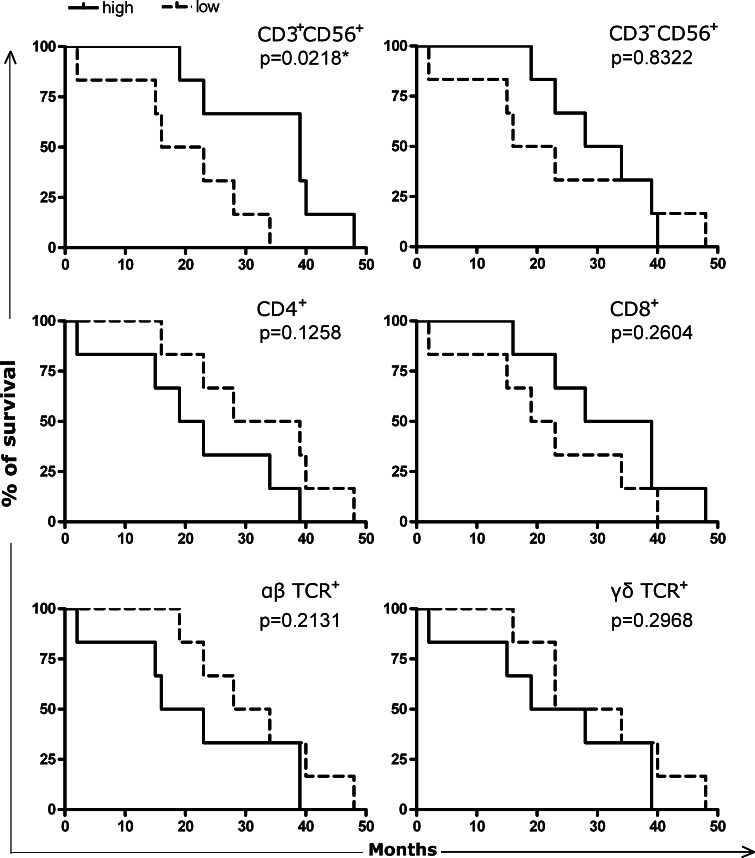
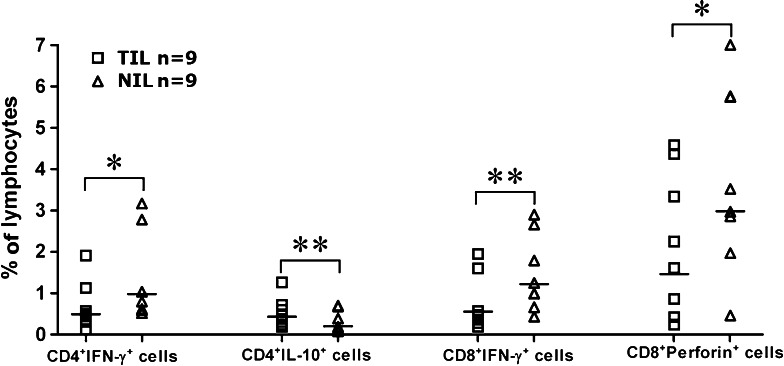
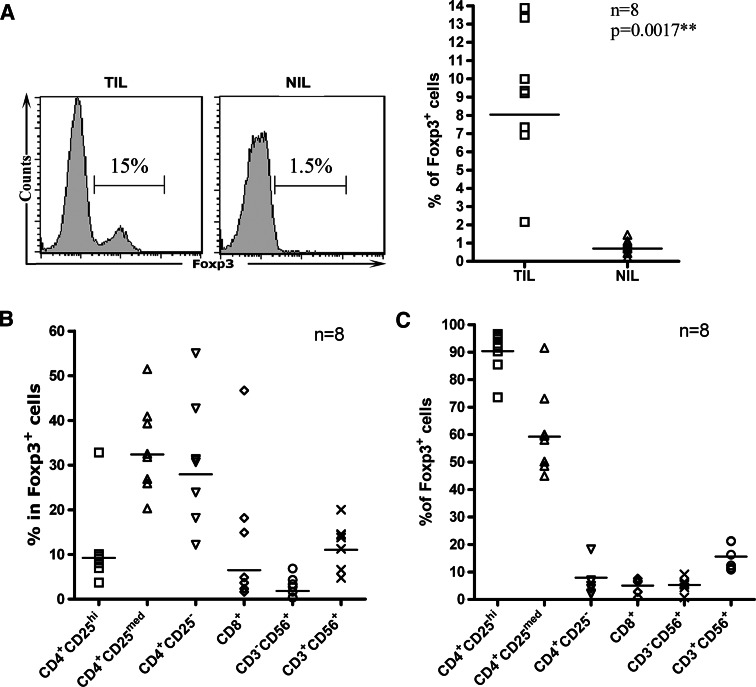
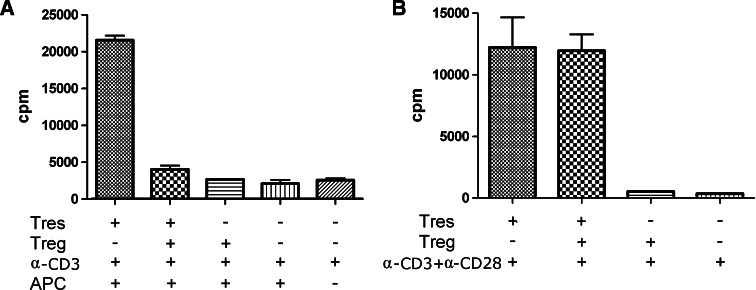
Increasing evidence indicates the immunosuppressive nature of the local environment in tumor. The present study was focused on analyzing the immune status within hepatocellular carcinoma. In contrast to the increasing number of CD4(+) T cells, CD8(+), CD3(-)CD56(+), CD3(+)CD56(+), and gammadeltaT cells were all found to be under-represented in tumor infiltrating lymphocytes. Notably, the relative abundance of CD3(+)CD56(+) cells appeared to be correlated with patient survival. Functional analysis demonstrated that CD4(+) cells in the tumor tended to produce more IL-10 but less IFN-gamma, whereas CD8(+) cells showed impaired capacity for the production of both IFN-gamma and perforin. Consistent with previous reports, we observed a significant increase of Foxp3(+) cells in the tumor tissue. Intriguingly, although over 90% of CD4(+)CD25(high) cells were found to be Foxp3(+), the majority of Foxp3(+) cells were identified in the CD4(+)CD25(medium) and CD4(+)CD25(-) subsets. In support of its role as a negative regulator, CD4(+)CD25(high) cells suppressed the proliferation of CD4(+)CD25(-) cells isolated from the same tissues in an APC dependent manner. In conclusion, the tumor microenvironment of hepatocellular carcinoma is featured by the presence of multiple immunosuppressive factors.


Figures

Fig. 1
Fig. 1
Phenotypic analysis of infiltrating lymphocytes in tumor or adjacent non-tumor tissues. a CD4/CD8 staining pattern of CD3+ lymphocytes from a representative patient (left) and the percentages of CD4+ or CD8+ cells in individual patients (right). b CD3/CD56 staining pattern of infiltrating lymphocytes from a representative patient (left) and the percentages of CD3+CD56, CD3CD56+, and CD3+CD56+ populations in individual patients (right). c γδTCR staining of infiltrating lymphocytes from a representative patient (left) and the percentages of γδTCR+ cells in individual patients (right). The number in the dot plot or histogram indicates the percentage of the corresponding subsets. *< 0.05, **< 0.01
Fig. 2
Fig. 2
Correlation of patient survival with the intratumoral accumulation of specific lymphocyte populations as indicated. Twelve patients with complete clinical data were divided into two groups of equal numbers based on the relative abundance of the specific subset of interest. The survival rate in each group is plotted against time after surgery. The significance of the difference was determined by the log-rank test, and the P value is shown at the top-right corner for each subset of cells
Fig. 3
Fig. 3
The expression levels of selective cytokines and perforin in tumor and non-tumor tissues as determined by real-time RT-PCR. Results were expressed as the ratio of the target sequence concentration relative to the housekeeping gene G3PDH. n = 19 for IL-2, IL-6, IL-10, IL-18, TNF-α, and TGF-β, 8 for the rest. *< 0.05, **< 0.01, ***< 0.001
Fig. 4
Fig. 4
Cytokine and perforin production by CD4+ and CD8+ cells in TIL and NIL as determined by intracellular staining. The percentage of cytokine- or perforin-producing CD4+ or CD8+ cells in TIL and NIL are shown for individual patients. *< 0.05, **< 0.01
Fig. 5
Fig. 5
Foxp3+ cells in tumor tissues. a Foxp3 staining of infiltrating lymphocytes from a representative patient (left) and the percentages of Foxp3+ cells in individual patients (right). b Detection of Foxp3+ cells in various subsets of infiltrating lymphocytes. The percentage of Foxp3+ cells in each subset is shown for individual patients. c Analysis of the subset composition of Foxp3+ cells. The percentage of each subset in Foxp3+ cells is shown for individual patients
Fig. 6
Fig. 6
The anti-proliferative effect of tumor infiltrating CD4+CD25high cells. CD4+CD25high cells and CD4+CD25 cells purified from tumor tissues were mixed at a ratio of 1:1. After 6 days of culture with appropriate stimuli, the proliferation of CD4+CD25 responder cells was measured by 3H thymidine incorporation. a Inhibition of cell proliferation induced by anti-CD3 with autologous irradiated TIL as APC. b Resistance of anti-CD3/CD28-induced proliferation to the inhibition by CD4+CD25high cells. Similar results were obtained with cells from four individual patients. Results from one representative patient are shown

References

    1. Abou-Shady M, Baer HU, Friess H, Berberat P, Zimmermann A, Graber H, Gold LI, Korc M, Buchler MW. Transforming growth factor betas and their signaling receptors in human hepatocellular carcinoma. Am J Surg. 1999;177:209–215. doi: 10.1016/S0002-9610(99)00012-4. - DOI - PubMed
    1. Barnett B, Kryczek I, Cheng P, Zou W, Curiel TJ. Regulatory T cells in ovarian cancer: biology and therapeutic potential. Am J Reprod Immunol. 2005;54:369–377. doi: 10.1111/j.1600-0897.2005.00330.x. - DOI - PubMed
    1. Bedossa P, Peltier E, Terris B, Franco D, Poynard T. Transforming growth factor-beta 1 (TGF-beta 1) and TGF-beta 1 receptors in normal, cirrhotic, and neoplastic human livers. Hepatology. 1995;21:760–766. - PubMed
    1. Beyer M, Schultze JL. Regulatory T cells in cancer. Blood. 2006;108:804–811. doi: 10.1182/blood-2006-02-002774. - DOI - PubMed
    1. Bricard G, Bouzourene H, Martinet O, Rimoldi D, Halkic N, Gillet M, Chaubert P, Macdonald HR, Romero P, Cerottini JC, Speiser DE. Naturally acquired MAGE-A10- and SSX-2-specific CD8+T cell responses in patients with hepatocellular carcinoma. J Immunol. 2005;174:1709–1716. - PubMed

Publication types

MeSH terms