Review
. 2008 Aug;36(1-4):69-86.
doi: 10.1007/s11068-008-9029-4. Epub 2008 Oct 22.

Reporting neural activity with genetically encoded calcium indicators

Affiliations
Review

Reporting neural activity with genetically encoded calcium indicators

S Andrew Hires et al. Brain Cell Biol. 2008 Aug.

Abstract

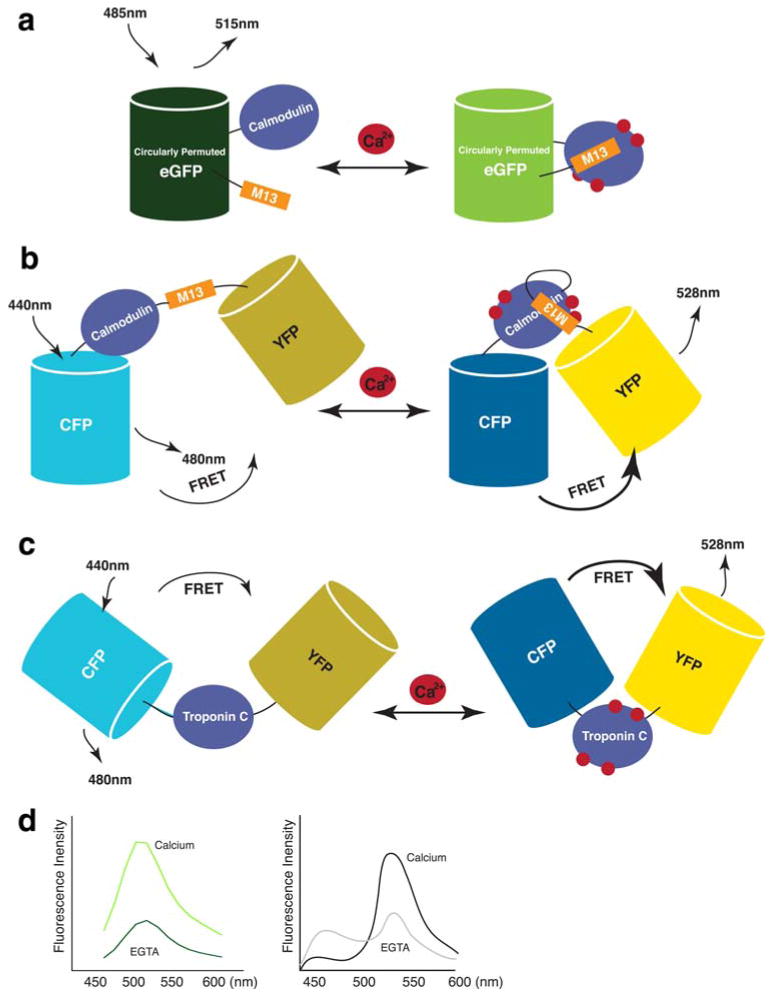
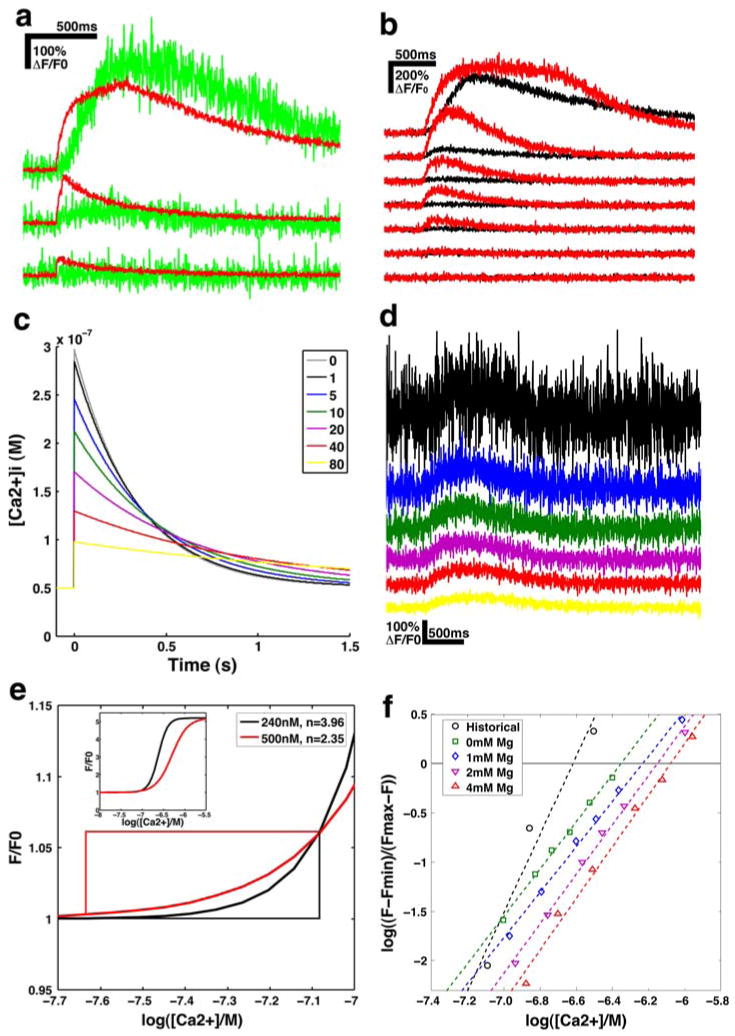
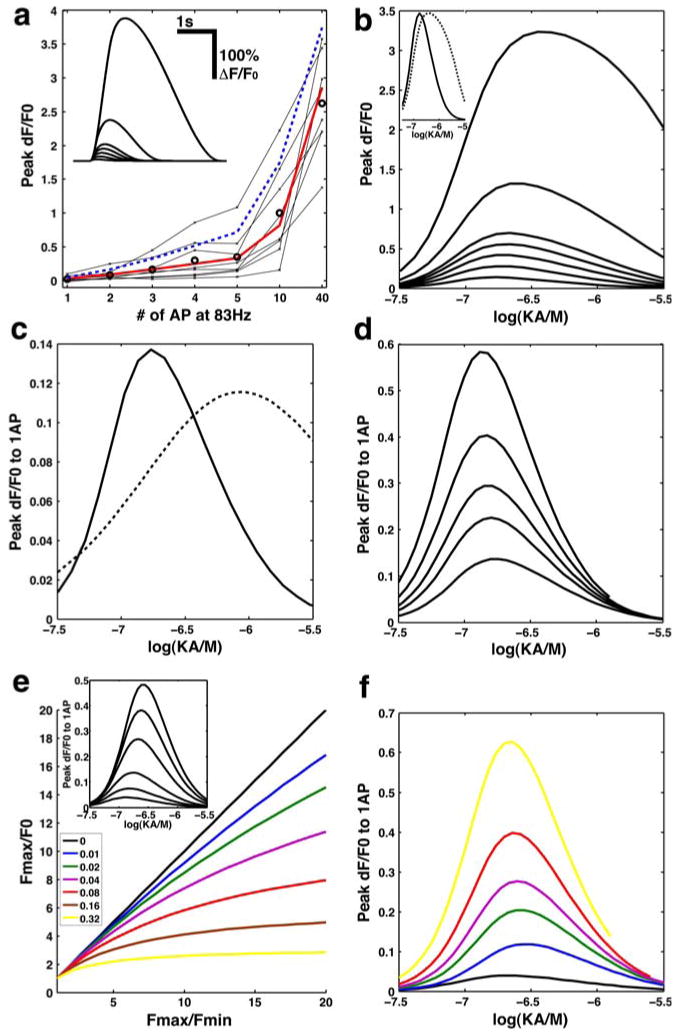
Genetically encoded calcium indicators (GECIs), based on recombinant fluorescent proteins, have been engineered to observe calcium transients in living cells and organisms. Through observation of calcium, these indicators also report neural activity. We review progress in GECI construction and application, particularly toward in vivo monitoring of sparse action potentials (APs). We summarize the extrinsic and intrinsic factors that influence GECI performance. A simple model of GECI response to AP firing demonstrates the relative significance of these factors. We recommend a standardized protocol for evaluating GECIs in a physiologically relevant context. A potential method of simultaneous optical control and recording of neuronal circuits is presented.


Figures

Fig. 1
Fig. 1
Schematic representation of several commonly used genetically encoded Ca2+ indicators (GECIs). GECIs are based either on change of florescence of a single fluorophore (a) or change in fluorescence resonance energy transfer (FRET) efficiency (b, c). (a) Schematic of G-CaMP sensing mechanism. Upon calcium binding, conformational change of CaM and formation of the CaM-M13pep complex increases the fluorescence of the circularly permuted GFP. (b) The cameleon family of FRET-based GECIs, in which CaM and the M13 peptide are bracketed by a FRET pair. Calcium binding to calmodulin increases emission from the FRET acceptor. (c) Troponin-based FRET GECIs, in which the skeletal muscle calcium sensor troponin-C (TnC) is bracketed by a FRET pair. Binding of calcium to TnC leads to a conformational change and an increase in FRET acceptor emission. (d) Schematic representations of the fluorescence change for G-CaMPs (left) and FRET indicators (right). In (b) and (c), CFP and YFP represent generic FRET donors and acceptors. These may be engineered or circularly permuted versions of eCFP and eYFP, or they may be alternate fluorescent proteins.
Fig. 2
Fig. 2
Properties that shape GECI response. (a) Typical fluorescence response of a G-CaMP2-expressing cell loaded with 500 μM X-Rhod-5F. Trains of 1, 5, and 40 AP delivered at 83 Hz by a whole-cell patch pipette. G-CaMP2 response in green, X-Rhod-5F response in red. (b) Variation of G-CaMP2 response to trains of 1, 2, 3, 4, 5, 10, and 40 APs, between two cells (red) and (black) of similar brightness, whole-cell parameters, and apparent health. (c) Increasing model [GECI] between 0, 1, 5, 10, 20, 40, 80 μM lowers the peak Δ[Ca2+]i transient and lengthens its time course. Model temperature is 22°C; τ ≈ 330 ms for the 0 μM case. (d) Increasing [GECI] improves the model's SNR at 10 AP despite lowering peak Δ[Ca2+]i. Colors as in c. (e) Sensitivity of F0 to the range of [Ca2+]0 in healthy neurons (23–83 nM). Affinity estimates derived from in vitro titrations of G-CaMP2 in historical buffer (black) or mock internal solution with 0.5 mM free Mg2+ (red). Inset shows titration over larger [Ca2+] range. (f) Titrations of G-CaMP2 in historical buffer or in mock internal solution with 0–4 mM Mg2+.
Fig. 3
Fig. 3
(a) Comparison of GECI model's peak ΔF/F0 (red line) for 1, 2, 3, 4, 5, 10, and 40AP trains to individual G-CaMP2 responses (thin lines) and the mean G-CaMP2 response (black circles). Increasing model kon and koff 5-fold (blue dotted line) increases response. (a, inset) Model fluorescence time course. (b) Predicted peak change in fluorescence over baseline to AP trains (1, 2, 3, 4, 5, 10, 40) for a range of KA values. (b, inset) 1AP (solid) and 40AP (dotted) trains normalized to optimal response. (c) Optimal affinity for 1AP response shifts between n = 2.5 (solid) and n = 1 (dotted). (d) Model response to 1AP increases with kinetic rates kon = (0.8, 1.6, 2.4, 4, and 8) × 106. (e) The dependence of effective dynamic range on total dynamic range is reduced as fractional saturation of model GECI at [Ca2+]0 increases from 0 to 0.32. (e, inset) Increasing total dynamic range (Fmax/Fmin = 2, 3, 5, 10, 15, 20) shifts the optimal KA for single AP detection from 130 to 260 nM. (f) Responses to 1AP when time course of calcium transient decay is decreased to 70 ms. n = 2.5, kon = 8 × 10⁵ M−1 s−1, Fmax/Fmin = 5 (black), kon = (8,16, 32, 40, and 80) × 105 M−1 s−1, Fmax/Fmin = 15 (colors).

References

    1. Ai HW, Olenych SG, Wong P, Davidson MW, Campbell RE. Hue-shifted monomeric variants of Clavularia cyan fluorescent protein: identification of the molecular determinants of color and applications in fluorescence imaging. BMC Biol. 2008;6:13. - PMC - PubMed
    1. Baird GS, Zacharias DA, Tsien RY. Circular permutation and receptor insertion within green fluorescent proteins. Proc Natl Acad Sci USA. 1999;96:11241–11246. - PMC - PubMed
    1. Burgoyne RD. Neuronal calcium sensor proteins: generating diversity in neuronal Ca2+ signalling. Nat Rev Neurosci. 2007;8:182–193. - PMC - PubMed
    1. Chronis N, Zimmer M, Bargmann CI. Microfluidics for in vivo imaging of neuronal and behavioral activity in Caenorhabditis elegans. Nat Method. 2007;4:727–731. - PubMed
    1. Clark DA, Gabel CV, Gabel H, Samuel AD. Temporal activity patterns in thermosensory neurons of freely moving Caenorhabditis elegans encode spatial thermal gradients. J Neurosci. 2007;27:6083–6090. - PMC - PubMed

Publication types

MeSH terms

Substances