. 2008 Dec 19;283(51):35941-53.
doi: 10.1074/jbc.M804543200. Epub 2008 Oct 21.

Abl kinases regulate autophagy by promoting the trafficking and function of lysosomal components

Affiliations

Abl kinases regulate autophagy by promoting the trafficking and function of lysosomal components

Gouri Yogalingam et al. J Biol Chem. .

Abstract

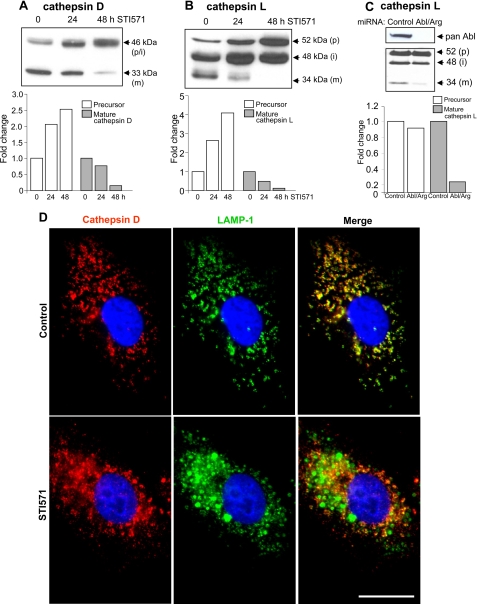
Autophagy is a lysosome-dependent degradative pathway that regulates the turnover of intracellular organelles, parasites, and long-lived proteins. Deregulation of autophagy results in a variety of pathological conditions, but little is known regarding the mechanisms that link normal cellular and pathological signals to the regulation of distinct stages in the autophagy pathway. Here we uncover a novel role for the Abl family kinases in the regulation of the late stages of autophagy. Inhibition, depletion, or knockout of the Abl family kinases, Abl and Arg, resulted in a dramatic reduction in the intracellular activities of the lysosomal glycosidases alpha-galactosidase, alpha-mannosidase and neuraminidase. Inhibition of Abl kinases also reduced the processing of the precursor forms of cathepsin D and cathepsin L to their mature, lysosomal forms, which coincided with the impaired turnover of long-lived cytosolic proteins and accumulation of autophagosomes. Furthermore, defective lysosomal degradation of long-lived proteins in the absence of Abl kinase signaling was accompanied by a perinuclear redistribution of lysosomes and increased glycosylation and stability of lysosome-associated membrane proteins, which are known to be substrates for lysosomal enzymes and play a role in regulating lysosome mobility. Our findings reveal a role for Abl kinases in the regulation of late-stage autophagy and have important implications for therapies that employ pharmacological inhibitors of the Abl kinases.


Figures

FIGURE 1.
FIGURE 1.
Inhibition of Abl kinases increases the accumulation of autophagosomes. A and C, A549 human lung carcinoma cells stably expressing GFP-LC3 (A549-GFP-LC3) were treated with 10 μm STI571 for 24 h (A, right) or transfected with Abl and Arg siRNAs (C, right), and were then analyzed by immunofluorescence. The pattern of GFP-LC3 staining in the cytosol changed from diffuse to predominantly punctate/vesicular. Scale bar = 20 μm. The number of cells with vesicular GFP-LC3 staining in control (DMSO) and STI571-treated cells (B), and in non-targeted control siRNA and Abl/Arg siRNA transfected cells (D), was scored in three individual fields at 20× magnification and expressed as a percentage of the total number of cells present. The results are represented as the mean (n = 3)±S.D. Both pharmacological inhibition and siRNA-mediated depletion of Abl kinases significantly increased autophagosome formation. **, p < 0.05 compared with the percentage of cells in control groups. E, subconfluent A549-GFP-LC3 cells were incubated with 10 μm or 30 μm STI571 for 24 h and analyzed by Western blotting with an anti-GFP antibody to monitor the relative amounts of GFP-LC3-I and GFP-LC3-II, or with phospho-CrkL and CrkL-specific antibodies as indicated. The results are representative of three independent experiments. The-fold changes in LC3-II levels are indicated below the blot. F, A549-GFP-LC3 cells were transfected with control siRNA or Abl/Arg siRNA oligonucleotides, and analyzed 48 h later by Western blotting as in panel E. The lysates were also analyzed for Abl and Arg protein levels using a pan Abl antibody.
FIGURE 2.
FIGURE 2.
Abl kinase inhibition impairs the degradation of long-lived proteins. A, sub-confluent A549-GFP-LC3 cells were treated with 10 μm STI571 or 2 μg/ml rapamycin for 24 h or 48 h and analyzed for activation markers of Abl kinase signaling (phospho-CrkL) and mTOR signaling (phospho-p70S6K). The results are representative of three independent experiments. B, the same lysates were also analyzed for GFP-LC3-I and GFP-LC3-II levels by Western blotting with an anti-GFP antibody. The -fold changes in LC3-II levels are indicated below the blot. C and D, analysis of basal and starvation-induced long-lived protein degradation in drug-treated A549-GFP-LC3 cells. A549-GFP-LC3 cells were metabolically labeled with [l-3H]leucine. The cells were then chased in complete medium for 6, 24, or 48 h (C) or in Earle's balanced salt solution media for 6 h (D). The media was supplemented with DMSO (control), 2 μg/ml rapamycin, 10 μm STI571, or 50 μg/ml vinblastine as indicated. At each time point the radioactivity released into the medium was measured by scintillation counting. [l-3H]Leucine turnover rates were determined by dividing the cpm in the medium by the total cpm (medium cpm + lysate cpm). E, A549 cells expressing control or Abl and Arg miRNAs were analyzed for starvation-induced long-lived protein degradation as in D except no drugs were added to the medium. F, Western blots of the corresponding cell lysates in E blotted with phospho-CrkL, CrkL and Abl-specific antibodies as indicated. G, analysis of starvation-induced long-lived protein degradation in Abl/Arg double knockout and Abl/Arg heterozygous MEFs. H, Western blots of the corresponding cell lysates in G blotted with phospho-CrkL, CrkL and Abl-specific antibodies as indicated. n = 3 ± S.D. **, p < 0.05 compared with the control (C and D), scramble (E), or Abl/Arg heterozygous (G) groups. The results for each autophagy assay are representative of three independent experiments.
FIGURE 3.
FIGURE 3.
Lysosome localization and motility is altered in the absence of Abl signaling. A, A549-GFP-LC3 cells were treated with DMSO (control) or 10 μm STI571 for 48 h, fixed and analyzed for LAMP-1 immunostaining. LAMP-1+ lysosomes (red) were dispersed widely throughout the cytosol in control cells, whereas lysosomes from STI571-treated cells aggregated in the perinuclear region. The size and intensity of LAMP-1+ lysosomes increased in STI571-treated cells. B, the distribution of individual lysosomes relative to the nucleus was measured in control and STI571-treated cells using MetaMorph software. The distribution of LAMP-1+ lysosomes, expressed as a fraction of the total, was plotted as a function of distance (pixels) from the nucleus. The graph in panel B represents the LAMP-1 distribution data for the control and STI571-treated cell shown in panel A. C, the lysosomes of control or STI571-treated A549 cells (48 h) were labeled with LysoTracker DND-99 and analyzed by live cell imaging over a 2-min acquisition period. The relative mobility of individual lysosomes was assessed by rainbow analysis. The first acquired image at time 0, the image acquired at 1 min, and the final images acquired at 2 min are pseudo-colored green, blue, and red, respectively (small panels) and then overlaid (large panels). Non-motile lysosomes are represented in white, whereas lysosomes that moved over the 2-min acquisition period are pseudo-colored. The results are representative of three independent experiments. D, the average velocity of 20 peripheral lysosomes and 20 perinuclear lysosomes in individual cells from control and STI571-treated cells (n = 5 cells per group) was quantified using Meta Morph software. The data are represented as the average velocity ± S.D. Scale bar = 20 μm.**, p<0.05 compared with the velocity of peripheral and perinuclear lysosomes in DMSO-treated control cells.
FIGURE 4.
FIGURE 4.
STI571 and rapamycin both induce autophagosome accumulation, but only STI571 affects lysosome localization and LAMP-1 protein levels and mobility. A, A549-GFP-LC3 cells were treated with 10 μm STI571 or 2 μg/ml rapamycin for 48 h and analyzed by immunofluorescence. In both STI571-treated cells and rapamycin-treated cells the pattern of GFP-LC3 staining in the cytosol changed from a diffuse to a predominantly punctate/vesicular appearance indicating increased levels of autophagosomes. LAMP-1+ lysosomes (red) were dispersed widely throughout untreated and rapamycin-treated cells, whereas lysosomes from STI571-treated cells clustered adjacent to the perinuclear region and often co-localized with GFP-LC3. These results are representative of three independent experiments. B, quantification of GFP-LC3 and LAMP-1 co-localization. The yellow and red images for individual stained cells described in the A (n = 3) were quantified using ImageJ software and expressed as a percentage to determine the proportion of LAMP-1+ lysosomes (red), which co-localized with GFP-LC3 (yellow in the merged images). **, p < 0.05 compared with the percentage of LAMP-1+/GFP-LC3+-positive lysosomes in control cells. Results are representative of three independent experiments. C, A549-GFP-LC3 cells were treated with 10 μm STI571 or 2 μg/ml rapamycin for up to 48 h as indicated and analyzed by Western blotting for LAMP-1 and β-tubulin levels. The data are representative of three independent experiments.
FIGURE 5.
FIGURE 5.
Abl kinase inactivation increases the stability and glycosylation of LAMP-1. A, Western blot analysis was employed to determine the relative amounts of LAMP-1, LAMP-2, phospho-CrkL, and total CrkL protein levels in A549 cells treated without (-) or with (+) 10 μm STI571 for 24 h. The levels of LAMP-1 and LAMP-2 proteins from STI571-treated cells were increased and migrated with a higher molecular weight on SDS-PAGE gels when compared with LAMP proteins from control cells (top two panels). B, A549-GFP-LC3 cells were transfected with a non-targeted control siRNA or Abl/Arg siRNA oligonucleotides and analyzed 48 h later by Western blotting as in A. The lysates were also analyzed for Abl and Arg protein levels using a pan-Abl antibody. C, the STI571-induced increase in LAMP-1 size is reversible. A549 cells were incubated with STI571 for up to 48 h and then analyzed for LAMP-1 levels by Western blotting. Where indicated, STI571 was removed after 48 h, and the medium was replaced with fresh medium for an additional 24 h prior to analysis (last lane). The absence of STI571 during the 24-h recovery period induced a shift in the mobility of LAMP-1 to a lower molecular weight. D, STI571 induces increased glycosylation of LAMP-1. A549 cells were treated with or without 10 μm STI571 for 24 h. Cell lysates were incubated in deglycosylation buffer with or without peptide N-glycosidase F as indicated for 16 h at 37 °C. The deglycosylation reactions were analyzed by immunoblotting with an anti-LAMP-1 antibody (Sigma). Incubation of A549 cells with STI571 resulted in an increase in the size of LAMP-1. Following deglycosylation of cell lysates with peptide N-glycosidase F (PNGaseF), the size of LAMP-1 was identical in both control and STI571-treated cell lysates. E, pharmacological inhibition of Abl kinase with STI571 increases the stability of LAMP-1. A549 cells were metabolically labeled with EXPRE35S35S-labeled amino acids for 24 h and then chased for 48 h in the presence of increasing concentrations of STI571 as indicated. Cell lysates were immunoprecipitated with anti-LAMP-1 (Sigma) or a control rabbit IgG and analyzed by SDS-PAGE and autoradiography. Duplicate unlabeled cells treated with the indicated concentrations of STI571 were analyzed by Western blotting for phospho-CrkL and total CrkL as indicated to confirm that Abl signaling was reduced in a dose-dependent manner.
FIGURE 6.
FIGURE 6.
Abl kinase inhibition impairs the processing and lysosomal localization of the cysteine proteases, cathepsin D and cathepsin L. A and B, A549-GFP-LC3 cells were incubated with or without 10 μm STI571 for 24 h or 48 h as indicated. Cell lysates were analyzed by Western blotting with anti-cathepsin D (A) and anti-cathepsin L (B) antibodies. Inhibition of Abl kinases with STI571 resulted in a time-dependent decrease in the processing of the precursor forms of cathepsin D and cathepsin L to their mature (activated), lower molecular weight forms, which characteristically accumulate in the lysosome. p = precursor, i = intermediate, and m = mature. The signal intensities of the precursor and mature cathepsin bands were determined using ImageJ software and demonstrated a progressive loss of the mature forms of cathepsin D and L over the 48-h incubation period with STI571 (graphs below each blot). C, A549 cells expressing a control scrambled miRNA or Abl6/Arg-9 miRNAs were analyzed by Western blotting with anti-cathepsin L antibody. D, the subcellular distribution of cathepsin D and LAMP-1 was analyzed in A549-GFP-LC3 cells by immunofluorescence. Cathepsin D displayed a punctate/vesicular staining pattern in control cells and frequently co-localized with LAMP-1, whereas cathepsin D in STI571-treated cells (48 h) did not co-localize with LAMP-1. Scale bar = 20 μm. The results are representative of three independent experiments.
FIGURE 7.
FIGURE 7.
Abl kinase inhibition impairs the activities of specific lysosomal hydrolases. A-D, the activities of the lysosomal hydrolases α-galactosidase (A), α-mannosidase (B), neuraminidase (C), and acid phosphatase (D) were analyzed in A549-GFP-LC3 cells treated with DMSO (control) or STI571 (10 μm) for up to 72 h using 4-methylumbelliferone-conjugated substrates (Sigma). E-H, A549-GFP-LC3 cells were transfected with a non-targeted control siRNA or Abl and Arg siRNA oligonucleotides, and analyzed 48 h later for α-galactosidase (E), α-mannosidase (F), neuraminidase (G), or acid phosphatase (H). Abl/Arg-double knockout MEFs and Abl/Arg-heterozygous MEFs were assayed for α-galactosidase (I), α-mannosidase (J), neuraminidase (K), or acid phosphatase (L). **, p < 0.05 compared with the DMSO-treated control (time 0, A-C), control siRNA (E-G), or Abl/Arg heterozygous (I-K) groups. No significant differences were observed for acid phosphatase activities (D, H, and L; p > 0.05). The results are representative of three independent experiments. M, schematic representation of the lysosome-related events that arise from inhibition of Abl kinase signaling.

References

    1. Rubinsztein, D. C., Gestwicki, J. E., Murphy, L. O., and Klionsky, D. J. (2007) Nat. Rev. Drug Discov. 6 304-312 - PubMed
    1. Meijer, A. J., and Codogno, P. (2004) Int. J. Biochem. Cell Biol. 36 2445-2462 - PubMed
    1. Sarbassov, D. D., Guertin, D. A., Ali, S. M., and Sabatini, D. M. (2005) Science 307 1098-1101 - PubMed
    1. Maiuri, M. C., Zalckvar, E., Kimchi, A., and Kroemer, G. (2007) Nat. Rev. Mol. Cell. Biol. 8 741-752 - PubMed
    1. Guertin, D. A., and Sabatini, D. M. (2007) Cancer Cell 12 9-22 - PubMed

Publication types

LinkOut - more resources