

Saccadic modulation of neural responses: possible roles in saccadic suppression, enhancement, and time compression
- PMID: 18945903
- PMCID: PMC6671356
- DOI: 10.1523/JNEUROSCI.3950-08.2008
Saccadic modulation of neural responses: possible roles in saccadic suppression, enhancement, and time compression
Abstract
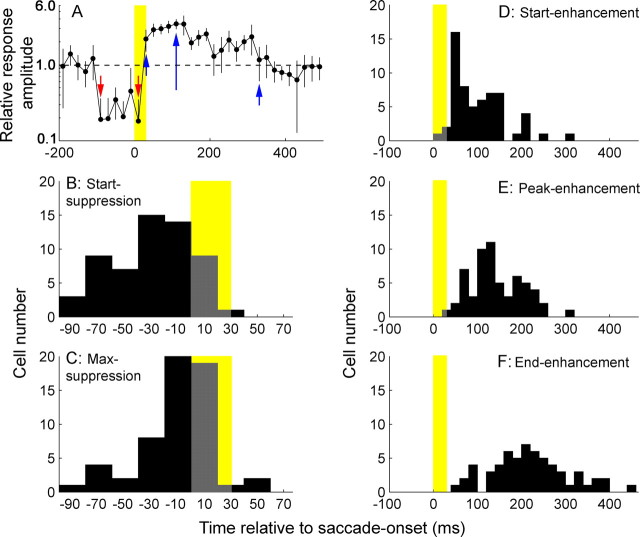
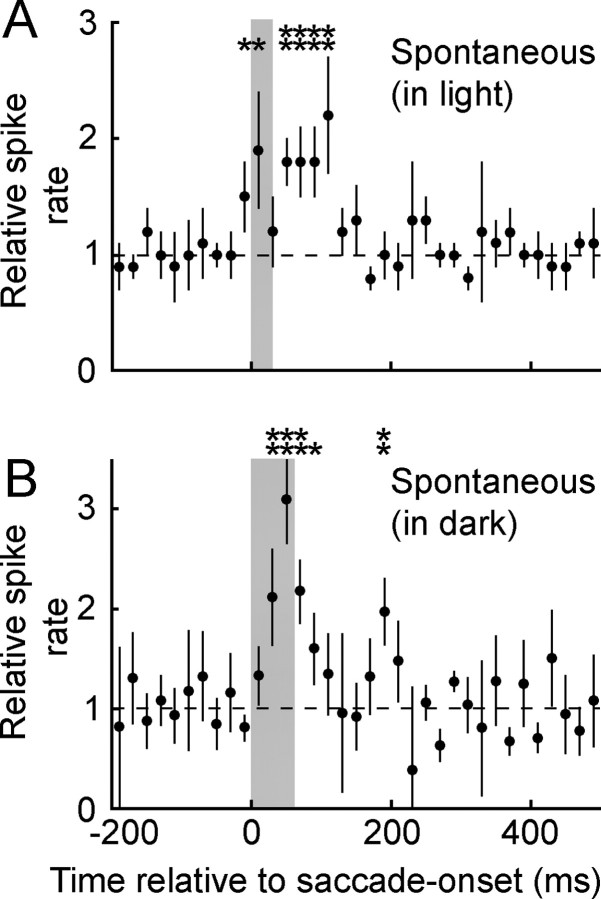
Humans use saccadic eye movements to make frequent gaze changes, yet the associated full-field image motion is not perceived. The theory of saccadic suppression has been proposed to account for this phenomenon, but it is not clear whether suppression originates from a retinal signal at saccade onset or from the brain before saccade onset. Perceptually, visual sensitivity is reduced before saccades and enhanced afterward. Over the same time period, the perception of time is compressed and even inverted. We explore the origins and neural basis of these effects by recording from neurons in the dorsal medial superior temporal area (MSTd) of alert macaque monkeys. Neuronal responses to flashed presentations of a textured pattern presented at random times relative to saccades exhibit a stereotypical pattern of modulation. Response amplitudes are strongly suppressed for flashes presented up to 90 ms before saccades. Immediately after the suppression, there is a period of 200-450 ms in which flashes generate enhanced response amplitudes. Our results show that (1) MSTd is not directly suppressed, rather suppression is inherited from earlier visual areas; (2) early suppression of the visual system must be of extra-retinal origin; (3) postsaccadic enhancement of neural activity occurs in MSTd; and (4) the enhanced responses have reduced latencies. As a whole, these observations reveal response properties that could account for perceptual observations relating to presaccadic suppression, postsaccadic enhancement and time compression.
Figures


Similar articles
-
Effects of saccades on visual processing in primate MSTd.Vision Res. 2010 Dec;50(24):2683-91. doi: 10.1016/j.visres.2010.08.020. Epub 2010 Aug 21. Vision Res. 2010. PMID: 20732345 Free PMC article.
-
Direction and contrast tuning of macaque MSTd neurons during saccades.J Neurophysiol. 2009 Jun;101(6):3100-7. doi: 10.1152/jn.91254.2008. Epub 2009 Apr 8. J Neurophysiol. 2009. PMID: 19357345 Free PMC article.
-
A neural locus for spatial-frequency specific saccadic suppression in visual-motor neurons of the primate superior colliculus.J Neurophysiol. 2017 Apr 1;117(4):1657-1673. doi: 10.1152/jn.00911.2016. Epub 2017 Jan 18. J Neurophysiol. 2017. PMID: 28100659 Free PMC article.
-
Visual perception and saccadic eye movements.Curr Opin Neurobiol. 2011 Aug;21(4):553-8. doi: 10.1016/j.conb.2011.05.012. Epub 2011 Jun 7. Curr Opin Neurobiol. 2011. PMID: 21646014 Free PMC article. Review.
-
Changes in visual perception at the time of saccades.Trends Neurosci. 2001 Feb;24(2):113-21. doi: 10.1016/s0166-2236(00)01685-4. Trends Neurosci. 2001. PMID: 11164942 Review.
Cited by
-
Signals conveyed in the pulvinar pathway from superior colliculus to cortical area MT.J Neurosci. 2011 Jan 12;31(2):373-84. doi: 10.1523/JNEUROSCI.4738-10.2011. J Neurosci. 2011. PMID: 21228149 Free PMC article.
-
Suppression and reversal of motion perception around the time of the saccade.Front Syst Neurosci. 2015 Oct 31;9:143. doi: 10.3389/fnsys.2015.00143. eCollection 2015. Front Syst Neurosci. 2015. PMID: 26582270 Free PMC article.
-
An equivalent noise investigation of saccadic suppression.J Neurosci. 2011 Apr 27;31(17):6535-41. doi: 10.1523/JNEUROSCI.6255-10.2011. J Neurosci. 2011. PMID: 21525294 Free PMC article.
-
Eye movements modulate the spatiotemporal dynamics of word processing.J Neurosci. 2012 Mar 28;32(13):4482-94. doi: 10.1523/JNEUROSCI.5571-11.2012. J Neurosci. 2012. PMID: 22457496 Free PMC article.
-
Saccades during object viewing modulate oscillatory phase in the superior temporal sulcus.J Neurosci. 2011 Dec 14;31(50):18423-32. doi: 10.1523/JNEUROSCI.4102-11.2011. J Neurosci. 2011. PMID: 22171044 Free PMC article.
References
-
- Burr DC, Morrone MC. Temporal impulse response functions for luminance and colour during saccades. Vision Res. 1996;36:2069–2078. - PubMed
-
- Burr DC, Morrone MC, Ross J. Selective suppression of the Magnocellular visual pathway during saccadic eye-movements. Nature. 1994;371:511–513. - PubMed
-
- Castet E, Jeanjean S, Masson GS. ‘Saccadic suppression’ - no need for an active extra-retinal mechanism. Trends Neurosci. 2001;24:316–318. - PubMed
Publication types
MeSH terms
Grants and funding
LinkOut - more resources
Full Text Sources
Research Materials