. 2008 Oct 22;28(43):10990-1002.
doi: 10.1523/JNEUROSCI.2697-08.2008.

Afferent deprivation elicits a transcriptional response associated with neuronal survival after a critical period in the mouse cochlear nucleus

Affiliations

Afferent deprivation elicits a transcriptional response associated with neuronal survival after a critical period in the mouse cochlear nucleus

Julie A Harris et al. J Neurosci. .

Abstract

The mechanisms underlying enhanced plasticity of synaptic connections and susceptibilities to manipulations of afferent activity in developing sensory systems are not well understood. One example is the rapid and dramatic neuron death that occurs after removal of afferent input to the cochlear nucleus (CN) of young mammals and birds. The molecular basis of this critical period of neuronal vulnerability and the transition to survival independent of afferent input remains to be defined. Here we used microarray analyses, real-time reverse transcription PCR, and immunohistochemistry of the mouse CN to show that deafferentation results in strikingly different sets of regulated genes in vulnerable [postnatal day (P)7] and invulnerable (P21) CN. An unexpectedly large set of immune-related genes was induced by afferent deprivation after the critical period, which corresponded with glial proliferation over the same time frame. Apoptotic gene expression was not highly regulated in the vulnerable CN after afferent deprivation but, surprisingly, did increase after deafferentation at P21, when all neurons ultimately survive. Pharmacological activity blockade in the eighth nerve mimicked afferent deprivation for only a subset of the afferent deprivation regulated genes, indicating the presence of an additional factor not dependent on action potential-mediated signaling that is also responsible for transcriptional changes. Overall, our results suggest that the cell death machinery during this critical period is mainly constitutive, whereas after the critical period neuronal survival could be actively promoted by both constitutive and induced gene expression.


Figures

Figure 1.
Figure 1.
Number of genes regulated by cochlear removal in the CN during and after the critical period. A, The mean log intensities in the CN ipsilateral to cochlear removal for all probes represented on the array are plotted against the contralateral side for P7 and P21 at 6, 12, 24, and 48 h. Differential expression was defined as ≥1.5-fold change ratio and p value ≤0.05 after a t test. Genes meeting these criteria are shown in red (upregulation) and green (downregulation), whereas genes that did not change significantly are shown in gray. The actual number of regulated genes at each time point is shown in the corners of each graph. A similar number of genes were regulated by cochlear removal at both ages; the largest response occurred at 24 h for both P7 and P21. B, Venn diagrams showing the number of genes either up- or downregulated collapsed over time for P7 and P21. The overlapping areas show the number of genes that met the criteria for differential expression in both ages after cochlear removal. Only 10% of the genes were shared, whereas the majority of genes responsive to cochlear removal were different during compared with after the critical period.
Figure 2.
Figure 2.
Temporal patterns of gene expression changes after cochlear removal during and after the critical period. There are 80 possible patterns a single gene could exhibit over time after cochlear removal. The numbers of genes at P7 and P21 exhibiting each expression pattern are shown to the right in each panel. Only those patterns with at least one gene are illustrated here. A, Patterns of genes upregulated or downregulated at one time point only. B, Patterns of genes with sustained upregulation or downregulation at more than one time point. C, Patterns of genes that switched in expression from up- to downregulated or down- to upregulated over time. Note that most genes showed a change in expression at one time point only (A). Many more P21 genes showed a sustained response compared with P7 (B), and more P7 genes exhibited a switching pattern over time (C). For each time point, red = significantly up, green = significantly down, gray = no change.
Figure 3.
Figure 3.
Distribution of functional categories after cochlear removal during and after the critical period. Up- and downregulated genes were categorized into one of 19 functional groups. To determine the net direction of change for each category the number of downregulated genes was subtracted from the number of upregulated genes both during (black) and after (gray) the critical period. Several functions showed net changes in different directions during and after the critical period. Apoptosis, cell cycle, heat shock/stress, and metabolism showed more up- than downregulated genes at P21, whereas ion transport, signal transduction, and structural/cytoskeletal genes showed more up- than downregulated genes at P7 compared with P21. The majority of genes upregulated by cochlear removal had immune-related functions at P21. At P7, signal transduction genes comprised the largest group, with the exception of unknowns. Note also that there was no net up or downregulation of the apoptotic group during the critical period at P7.
Figure 4.
Figure 4.
Regulation of immune genes and glial cells after the critical period. A, All genes significantly up- and downregulated by cochlear removal with immune roles at P21 are listed by time of appearance. B, Confirmation of microarray results for 4 of these immune-related genes. Fold change ratios measured using microarrays (black) and real-time RT PCR (gray) are shown at 6, 12, 24, and 48 h after cochlear removal. The asterisk indicates the time points at which the microarray results were considered significant. All 4 of these genes showed a change using PCR in the same direction and of similar magnitude as the significant time points for the microarray results. Error bars indicate 1 SD. C, Immunohistochemical analysis of microglial Iba1 immunoreactivity 24 and 48 h after cochlear removal at P7 and P21. Representative examples of Iba1 labeling after 48 h of afferent deprivation in the P21 CN ipsilateral and contralateral to surgery. The percentage of total CN area covered with Iba1+ cells was significantly greater in the ipsilateral CN 48 h after surgery at P21, but not when surgery was done during the critical period at P7. Scale bar, 50 μm. D, The number of cells that have left G0 as indicated by PCNA immunolabeling was quantified over time after cochlear removal in the postcritical period CN. Proliferation peaked at 48 h and returned to control levels by 192 h after cochlear removal in the ipsilateral CN. Error bars indicate SEM.
Figure 5.
Figure 5.
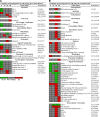
Selected candidate genes. A, Genes with possible roles in promoting cell death that were regulated after cochlear removal during the critical period in the P7 CN. B, Genes with possible roles in promoting cell survival that were regulated by cochlear removal after the critical period in the P21 CN. Differential expression was defined by ≥1.5-fold change and a p value ≤0.05. Genes are arranged by broad functional categories. The “V” marks genes also validated by real-time RT PCR.
Figure 6.
Figure 6.
Validation of microarray results using-real time RT PCR. A, The relationship between PCR and microarray measurements of fold change ratios for a subset of genes at the time point(s) they were considered significantly regulated by microarray analyses. There was a significant positive correlation between PCR and microarray results for both ages (p < 0.01). B, C, Twelve examples of genes identified by microarray analysis at P7 (B) and P21 (C) validated by PCR. The fold change ratios measured using microarrays (black) and real-time RT PCR (gray) are shown at 6, 12, 24, and 48 h after cochlear removal for each gene. The asterisk indicates the time point at which the microarray results were considered significant. Error bars indicate 1 SD.
Figure 7.
Figure 7.
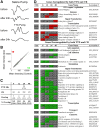
Effects of TTX embedded in PVA on hearing and gene expression. Auditory brainstem responses to 82 dB clicks in P21 mice are shown (A–C). In a subset of mice used only for ABR recordings, one cochlea was removed before recordings, so that elimination of the evoked auditory potentials in the remaining ear results in total elimination of the ABR. A, Cochlear removal results in the complete elimination of any recordable ABR compared with the same response recorded before surgery. B, Sham surgery does not eliminate the ABR. C, TTX embedded in PVA eliminates the ABR within 15 min and remains effective 6 h later. After 24 h the ABR appears similar to the pre-TTX recordings. Scale bars, 1 ms/μV. Only genes regulated 6 h after both cochlear removal and TTX are shown of seven tested. D, Three genes downregulated by cochlear removal at P7 were also downregulated by TTX placed in the ear. Note the microarrays did not detect a decrease in c-Fos mRNA expression at P7, whereas PCR did detect a change after cochlear removal. E, At P21, five genes downregulated by cochlear removal were also decreased in expression by TTX. Error bars indicate 1 SD.
Figure 8.
Figure 8.
Effects of TTX delivered by osmotic pump on hearing and gene expression. A, Auditory brainstem responses are shown as in Figure 7. Osmotic pumps filled with saline do not deafen mice as measured by ABR 24 h later. TTX does eliminate the ABR for up to 24 h after osmotic pump implantation. B, The mean log intensities in the P21 CN after 24 h of TTX for all probes represented on the array are plotted against the contralateral, control side. Differential expression was defined as ≥1.5-fold change ratio and p value ≤0.05 after a t test. Genes meeting these criteria are shown in red (upregulation) and green (downregulation), whereas genes that did not change significantly are shown in gray. C, Listed are the number of genes identified by microarray analyses after 24 h of TTX or cochlear removal (CR) at 6, 12, 24, and 48 h. The first numbers are significant by the criteria listed above. The numbers in parentheses refer to genes that have met relaxed selection criteria (FC >1.3 with p ≤ 0.05 or FC >1.5 with p ≥ 0.05). Even with the relaxed selection criteria, only 10–25% of the genes regulated by cochlear removal at any time point are also regulated by 24 h of TTX exposure. D, All genes up- and downregulated by both TTX and cochlear removal are listed by broad functional categories. Genes that met the more strict selection criteria are shown in red or green, with the fold change values listed in all boxes. Genes regulated by both TTX and cochlear removal included several already on the P21 candidate list, and previously verified by real-time RT PCR.

References

    1. Akgul C, Moulding DA, Edwards SW. Alternative splicing of Bcl-2-related genes: functional consequences and potential therapeutic applications. Cell Mol Life Sci. 2004;61:2189–2199. - PMC - PubMed
    1. Ashburner M, Ball CA, Blake JA, Botstein D, Butler H, Cherry JM, Davis AP, Dolinski K, Dwight SS, Eppig JT, Harris MA, Hill DP, Issel-Tarver L, Kasarskis A, Lewis S, Matese JC, Richardson JE, Ringwald M, Rubin GM, Sherlock G. Gene ontology: tool for the unification of biology. The Gene Ontology Consortium. Nat Genet. 2000;25:25–29. - PMC - PubMed
    1. Bains JS, Shaw CA. Neurodegenerative disorders in humans: the role of glutathione in oxidative stress-mediated neuronal death. Brain Res Brain Res Rev. 1997;25:335–358. - PubMed
    1. Benn SC, Perrelet D, Kato AC, Scholz J, Decosterd I, Mannion RJ, Bakowska JC, Woolf CJ. Hsp27 upregulation and phosphorylation is required for injured sensory and motor neuron survival. Neuron. 2002;36:45–56. - PubMed
    1. Boise LH, González-Garcia M, Postema CE, Ding L, Lindsten T, Turka LA, Mao X, Nuñez G, Thompson CB. bcl-x, a bcl-2-related gene that functions as a dominant regulator of apoptotic cell death. Cell. 1993;74:597–608. - PubMed

Publication types

MeSH terms