. 2008 Oct 22;28(43):11015-23.
doi: 10.1523/JNEUROSCI.2478-08.2008.

Roles of ephrin-as and structured activity in the development of functional maps in the superior colliculus

Affiliations

Roles of ephrin-as and structured activity in the development of functional maps in the superior colliculus

Jianhua Cang et al. J Neurosci. .

Abstract

The orderly projections from retina to superior colliculus (SC) preserve a continuous retinotopic representation of the visual world. The development of retinocollicular maps depend on a combination of molecular guidance cues and patterned neural activity. Here, we characterize the functional retinocollicular maps in mice lacking the guidance molecules ephrin-A2, -A3, and -A5 and in mice deficient in both ephrin-As and structured spontaneous retinal activity, using a method of Fourier imaging of intrinsic signals. We find that the SC of ephrin-A2/A3/A5 triple knock-out mice contains functional maps that are disrupted selectively along the nasotemporal (azimuth) axis of the visual space. These maps are discontinuous, with patches of SC responding to topographically incorrect locations. The patches disappear in mice that are deficient in both ephrin-As and structured activity, resulting in a near-absence of azimuth map in the SC. These results indicate that ephrin-As guide the formation of functional topography in the SC, and patterned retinal activity clusters cells based on their correlated firing patterns. Comparison of the SC and visual cortical mapping defects in these mice suggests that although ephrin-As are required for mapping in both SC and visual cortex, ephrin-A-independent mapping mechanisms are more important in visual cortex than in the SC.


Figures

Figure 1.
Figure 1.
Functional retinotopic maps in the superior colliculus. A, A stimulus monitor is placed 25 cm away from the anesthetized mouse, contralateral to the hemisphere being imaged. B–D, Elevation map in the SC of a WT mouse. Both retinotopy (C) and response magnitude (D) are shown. The color code used to represent positions of different elevation lines on the stimulus monitor is illustrated in B, and the gray scale for response amplitude as fractional change in reflection × 104 is shown to the right of D. E, Plot of visual field elevation as a function of collicular distance along the 0° line in the mouse's azimuth map (G). F–I, Azimuth map in the same mouse.
Figure 2.
Figure 2.
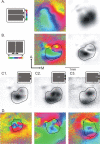
SC maps revealed by spatially restricted stimuli. A, Full screen azimuth map of a WT mouse. In the middle panel, the retinotopy is represented by color according to the color scales shown in the top panel, and the response magnitude is illustrated by lightness. The map of magnitude is shown separately in the bottom panel for clarity. B–D, Retinotopic maps and magnitude in response to spatially restricted stimuli as illustrated at top row. The black contour on each map of response magnitude circles the region activated by full screen stimulus (thresholded at a level of 40% of the peak response).
Figure 3.
Figure 3.
Retinotopic maps in the superior colliculus of ephrin-A2/A3/A5 triple KOs. A, Full screen elevation map of an ephrin-A triple KO. B, Full screen azimuth map of the same mouse. The black contour circles the region activated in the elevation map (40% of peak response). Note the discontinuous and patchy map. C1–C3, Maps of response magnitude to spatially restricted stimuli of the same mouse. Note the patchy patterns of activation, which correlates closely to the corresponding color in the full-screen azimuth map in B. Asterisks mark the same threes points of SC in B and C to help the comparisons. D, Additional examples of full-screen azimuth maps of ephrin-A triple KOs.
Figure 4.
Figure 4.
Retinotopic maps in the superior colliculus of ephrin-A mutants. A1, A2, Elevation (A1) and azimuth (A2) maps of an ephrin-A2−/−A3−/−A5+/− mouse. The black contour circles the region activated in the elevation map (40% of peak response). B1, B2, Elevation (B1) and azimuth (B2) maps of an ephrin-A2−/−A3+/−A5−/− mouse. C1, C2, Plots of azimuthal location along 0° elevation line of ephrin-A2A3A5 compound heterozygotes (C1) and triple KOs (C2).
Figure 5.
Figure 5.
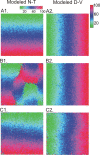
Modeling map formation in the presence and absence of ephrin-As. The SC is represented by a 100 × 100 matrix, which are the termination sites for RGC axons. The formation of retinotopic map in SC depends on two components: graded guidance cues and activity-dependent refinement. A1, A2, Resulted maps with these two components, with the color codes of retinal positions shown at the top. B1, B2, Removal of guidance cues along the azimuth axis results in discontinuous, patchy maps along this axis (B1), while leaving the elevation axis (B2) mostly normal. C1, C2, Modeled maps in the absence of activity-dependent refinement process.
Figure 6.
Figure 6.
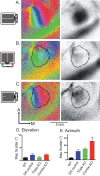
Retinotopic maps in the superior colliculus of ephrin-A2/A5-β2 combination KO. A, Elevation map of an ephrin-A2−/−A5−/−ß2−/− mouse. Both maps of retinotopy and response magnitude are shown. B, Azimuth map of the same mouse. The black contour circles the region activated in the elevation map (40% of peak response). Note the lack of retinotopic progression in the SC. C, Response to a spatially restricted stimulus, shown to the left. D, E, Map scatter of elevation (D) and azimuth (E) maps of different genotypes.
Figure 7.
Figure 7.
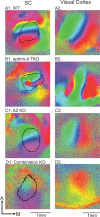
Comparison of azimuth maps in the superior colliculus and visual cortex. A1, A2, Azimuth maps in the SC (A1) and visual cortex (A2) of a WT mouse. The black contour circles the region activated in the elevation map (40% of peak response). B1, B2, Azimuth maps of an ephrin-A2/A3/A5 triple KO. Note that the SC map (B1) is patchy, and the V1 map (B2) is not, but blurred. C1–D2, Azimuth maps of a β2 KO (C) and an ephrin-A2/A5-β2 combination KO (D).

References

    1. Alonso JM, Usrey WM, Reid RC. Rules of connectivity between geniculate cells and simple cells in cat primary visual cortex. J Neurosci. 2001;21:4002–4015. - PMC - PubMed
    1. Ballesteros JM, Sun C, Goloshchapov AV, Cheng H, Chalupa LM. Developing nAChR β2−/− mice manifest retinal waves of action potentials as well as altered retinogeniculate projection patterns. Soc Neurosci Abstr. 2007;33:346–21.
    1. Bansal A, Singer JH, Hwang BJ, Xu W, Beaudet A, Feller MB. Mice lacking specific nicotinic acetylcholine receptor subunits exhibit dramatically altered spontaneous activity patterns and reveal a limited role for retinal waves in forming ON and OFF circuits in the inner retina. J Neurosci. 2000;20:7672–7681. - PMC - PubMed
    1. Brown A, Yates PA, Burrola P, Ortuño D, Vaidya A, Jessell TM, Pfaff SL, O'Leary DD, Lemke G. Topographic mapping from the retina to the midbrain is controlled by relative but not absolute levels of EphA receptor signaling. Cell. 2000;102:77–88. - PubMed
    1. Bruno RM, Sakmann B. Cortex is driven by weak but synchronously active thalamocortical synapses. Science. 2006;312:1622–1627. - PubMed

Publication types

LinkOut - more resources